Team I Comparative Genomics Group
Team 1 Comparative Genomics
Team members: Heather Patrick, Lawrence McKinney, Laura Mora, Manasa Vegesna, Kenji Gerhardt, Hira Anis
Summary
- Our team identified the bacterial pathogen Escherichia coli O103:H2 str. 12009 the outbreak strain caused the food-borne illness that we investigated.
- Our team identified 26 isolates as part of the outbreak strain.
- Our team determined that the outbreak started in April 2019, with the first reported case occurring on April 15, and ended in early June 2019, with the last reported case happening on June 6. Montana, Georgia, and Washington state (see Figure 8) were affected. The likely food sources of the outbreak pointed to melons, bananas, and chorizo. Further investigation would need to be conducted to confirm and to rule out potential red herrings collected during data collection.
- Our team recommends reporting the following recommendations to the CDC:
- The outbreak strain had a relatively limited ARG profile (see Figure 11b). Although some drugs may be able to treat all strains, inhibiting the selection of ARG response to new drugs is wise.
- Results suggest that we recommend the use of an antibiotic of either Phenicol or sulfonamide class.
- Resistances exist to these in the sporadic cases of documented in our investigation, but not the outbreak strains.
- We recommend investigating the supply chain of chorizo, banana, and melon and perhaps suggesting recalls of these from stores in Montana, Georgia, and Washington.
Introduction and Objectives
Comparative genomics is a field in biomedical research in which the genomic features of different organisms are compared. In short, it involves the comparison of one genome to another. This type of comparative analysis can be utilized to discover what lies hidden within the sequences of genomes by comparing sequencing information. Comparative genomics has utilities in gene prediction, regulatory element prediction, phylogenomics, pharmacogenomics, pathogenicity and more. For the purposes of our analysis, we will employ comparative genomics tools to conduct an outbreak analysis. More specifically, we will compare assembled bacterial genomes to generate knowledge that will help us identify and characterize a bacterial outbreak strain of Escherichia coli (E. coli). We will then apply our computational results to known biological insights and matched epidemiological to further characterize the identified bacterial strain. This data will be used to propose treatment options and a response to the outbreak that can be used by public health professional to address the food-borne illness.
Our Data
- 50 isolates of Escherichia coli from an outbreak of foodborne illnesses. The genomes have been assembled and fully annotated.
- Epidemiological data consisting of: times, locations (states), and ingested foods of each case.
Our Bacteria
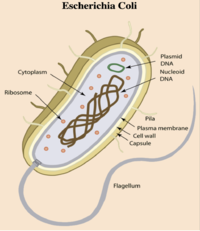
- E. coli is a gram-negative bacterium composed of numerous strains and serotypes (see Figure 1).
- E. coli contains plasmids (mobile genetic elements ) which generate genome diversity by promoting homologous recombination, horizontal gene transfer between bacteria, and can confer antimicrobial resistance and virulence.
- About ~46% of E. coli genome is conserved among all strains (core genome)
- E. coli occurs naturally in the lower part of the intestines of humans and warm-blooded animals, and under certain conditions, even commensal, “nonpathogenic” strains can cause infection.
- E. coli is typically transmitted through ingestion of contaminated food and water, person-to-person contact, contact with fomites.
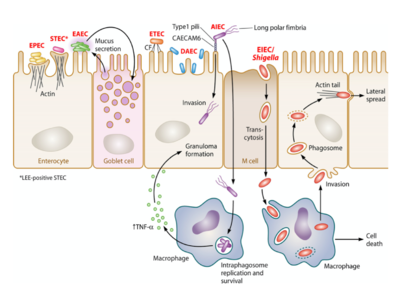
- There are 8 types of pathogenic strains of E. coli (see Figure 2):
- Enteropathogenic E. coli(EPEC)
- Enteroaggregative E. coli (EAEC)
- Enterotoxigenic E. coli (ETEC)
- Enteroinvasive E. coli (EIEC)
- Enterohamerrhagic E. coli (EHEC)
- Diffusely Adherent E. coli (DAEC)
- Adherent Invasive E. coli (AIEC)
- Shiga Toxin (Stx) producing Enteroaggregative E. coli (STEAEC)
- Strains representative of a pathotype contained shared genes as well as unique genes.
- Pathogenic E. coli is typically transmitted through ingestion of contaminated food and water, person-to-person contact, or contact with fomites. It typically invades and colonizes in the epithelium of the intestines.
E. coli Mobile Genetic Elements
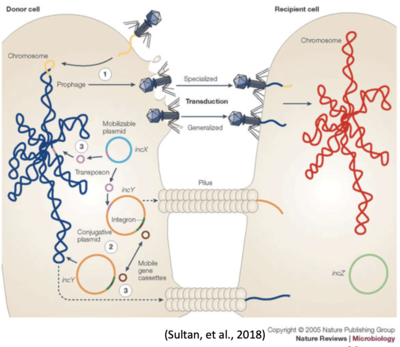
Bacterial cells transfer DNA between one another in three distinct ways (see Figure 3):
- Transduction (1)
- Conjugation (2)
- Transformation (3)
Transduction and conjugation depend on mobile genetic elements (MGEs), including most large plasmids and some bacteriophages. Pathogenomic analysis of the numerous plasmids present within representative strains of E. coli pathotypes (and commensal E. coli) has revealed considerable diversity and plasticity within these MGEs. Plasmids and bacteriophages play a major role in generating genome diversity by promoting homologous recombination and horizontal gene transfer between bacteria.
Team Objectives
- Compare and contrast functional & structural features of isolates.
- Antibiotic Resistance profile
- Virulence profile
- Differentiate outbreak vs. sporadic strains.
- Characterize the virulence and antibiotic resistance functional features of outbreak isolates.
- Identify the source and spread of the outbreak.
- Recommend outbreak response and treatment.
Methods
There are many ways to conduct comparative analysis on bacteria for the purposes of pathotyping/serotyping. We decided to perform analysis based on comparing bacterial genomes at different levels of resolution by discriminating our genome analysis at the whole genome level --> gene level --> SNP level. Detailed below are the tools and rationale for using the comparative genomics tools to achieve our research objectives.
WHOLE GENOME LEVEL ANALYSIS
- MUMmer v.04:
- An open source bioinformatic tool used align and compare entire genomes at varying evolutionary distances.
- It uses “Maximal Unique Matches” as pairwise anchor points to help improve the biological quality of the output alignments.
- Pros:
- Fast and efficient aligner
- Optimal for comparing two related bacterial strains
- Highly cited bioinformatics system in scientific literature (> 900 total citations; + 200 since 2018)
- Cons:
- Higher false alignment rate (FAR) when compared to similar tools.
GENE LEVEL ANALYSIS
- MLST: Multi Locus Sequence Typing
- A low-resolution classification to categorize different clonal expressions of pathogens into broad categories.
- The concept is based on allelic variation amongst highly conserved housekeeping genes (the schemes)
- The nomenclature is still widely used by clinicians and microbiologists
- There are bioinformatics tools that use raw sequence reads and others than use de novo assemblies.
- Three schemes available for Escherichia coli : Achtman,Pasteur, Whittam schemes (7:8:15)
- PubMLST ONLY USES Achtman and Pasteur
- chewBBACA:
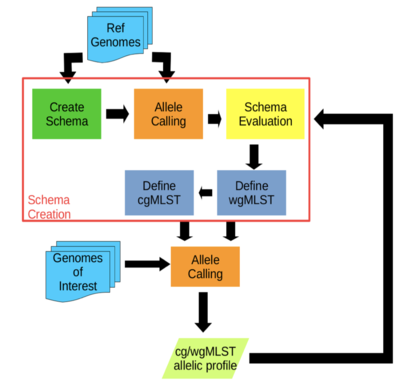
- A comprehensive pipeline for the creation and validation of whole genome and core genome MLST schemas (see Figure 4)
- Schema creation and allele calls are done on complete or draft genomes resulting from de novo assemblers
- The allele calling algorithm is based on BLAST Score Ratio that can be run in multiprocessor settings
- Performs allele calling in a matter of seconds per strain
- Visualizes and evaluates allele variation in the loci
SNP LEVEL ANALYSIS
- Single Nucleotide Polymorphisms are mutations with a single DNA base substitution. When found in exonic regions, they can result in amino acid variants in the protein products or changes in protein length due to their effects on stop codons.
- Identification of SNPs across bacterial genomes is important for outbreak tracking, phylogenetic analysis and identifying strain differences that are important to phenotypes such as virulence and antibiotic resistance.
- Main Objective: Identify SNPs and produce a phylogenetic tree which will help us identify the source and strain of the organism causing the outbreak.
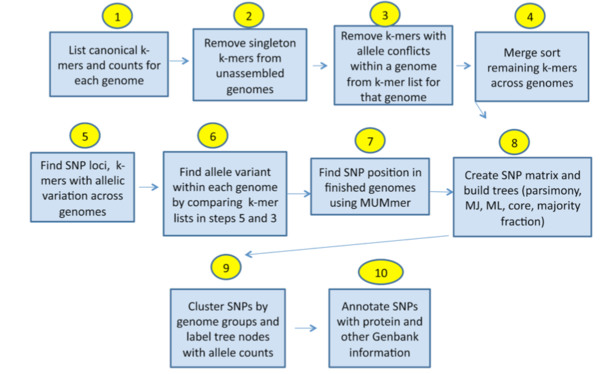
- kSNP3 (see figure 5):
- Identifies all pan-genome SNPs in a set of given genome sequences and estimates phylogenetic trees based upon the identified SNPs.
- SNP identification is based on k-mer analysis
- kSNP builds Maximum Likelihood, Neighbor Joining and Parsimony Phylogenetic trees
- Doesn’t require a multiple sequence alignment or the selection of a reference genome
- SNPs are annotated from GenBank files.
- Pros:
- Has been tested on 68 finished E.coli genomes
- Can efficiently analyze distantly-related genomes
- Avoids biases stemming from the choice of a reference genome
- Finds SNPs which are present in core and non-core regions
- Cons:
- Cannot find SNPs that are too close to each other
- Using a bigger k-mer size will compromise the identification of high density SNPs
- A smaller k-mer size could cause an increase in allele conflicts
- When using raw reads, the tool sometimes cannot distinguish between true SNPs from sequencing errors
| Tool Name | Year | Based on | Advantages | Disadvantages |
|---|---|---|---|---|
| kSNP v. 3.0 (see figure 5) | 2015 | K-mer Analysis | Faster than multiple-alignment and reference-based methods. Has been tested on 68 genomes of E.coli | Cannot identify SNPs which are close to each other |
| BactSNP | 2019 | De-novo Assembly and Alignment Information | Can be run without a reference genome and has been benchmarked against other tools/pipelines for bacterial genomes | Doesn’t produce phylogenetic trees |
| ParSNP | 2014 | Multiple genome alignment | Designed for microbial genomes. Avoids biases from mapping to a single reference | Cannot handle subset data, only works well for core genomes. Not as sensitive as the other tools. Should be used in combination with a visualizer |
| RealPhy | 2014 | Multiple reference sequence alignment | Avoids biases which come from using one reference genome | Requires a reference genome |
Table 1 Evaluation criteria of SNP tools.
Results
Whole Genome Level Analysis Results
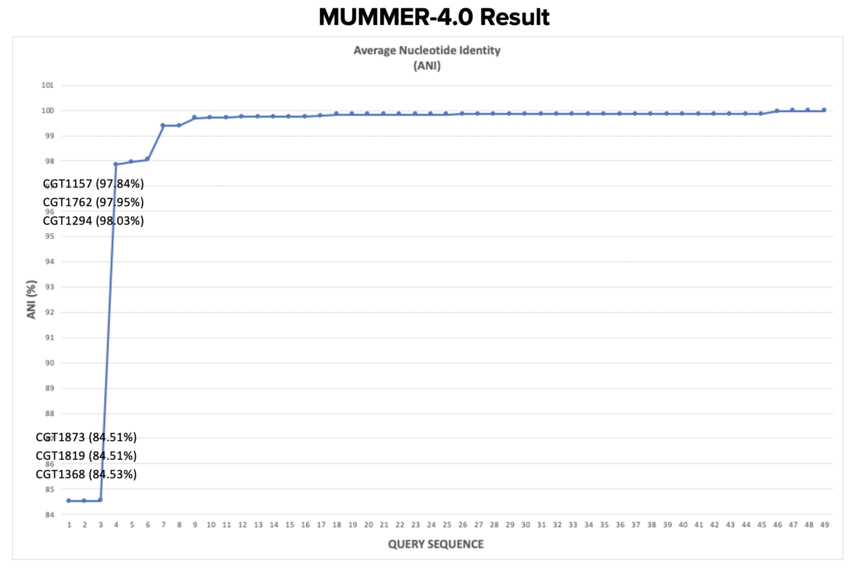
- Query genome (50 isolates we investigated) were compared to Reference genome (CGT1001)
- Average Nucleotide Identity (ANI) was compared among all genomes.
- Three isolates had a relatively low ANI% - around 84%
- Three isolates had an ANI% between 97-98% - signifying there were differences in regions of the genome compared to the reference.
- The forty-three remaining isolates were closely related (~99%) to the reference genome.
- This tool has low resolution and did not discriminate more details about differences seen between highly similar genomes.
- Other comparative genomic tools were employed for higher resolution.
Gene Level Analysis Results
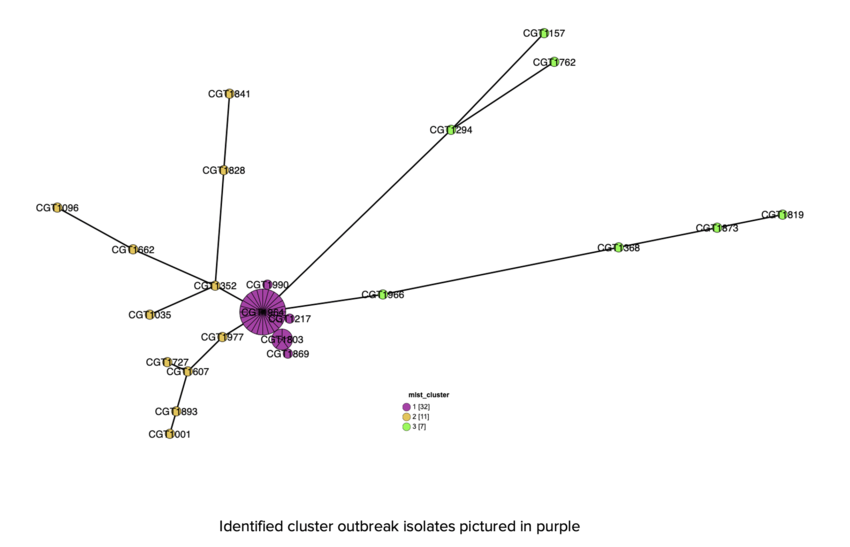
- Our team used chewBBACA to create a schema and do allele calling on the assembled genomes of the 50 isolates
- Initial results were visualized using Grapetree before doing deeper epidemiological analysis

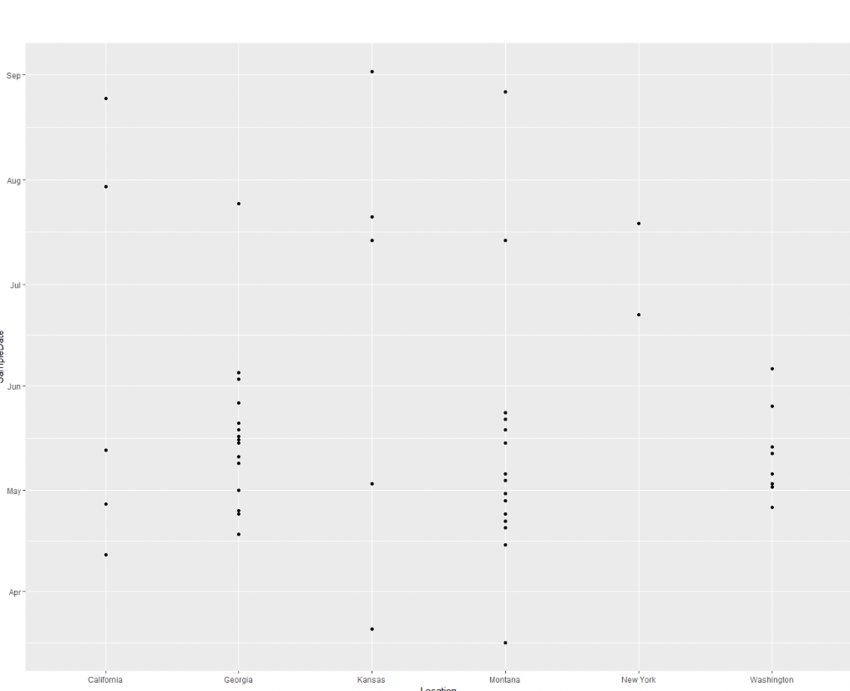
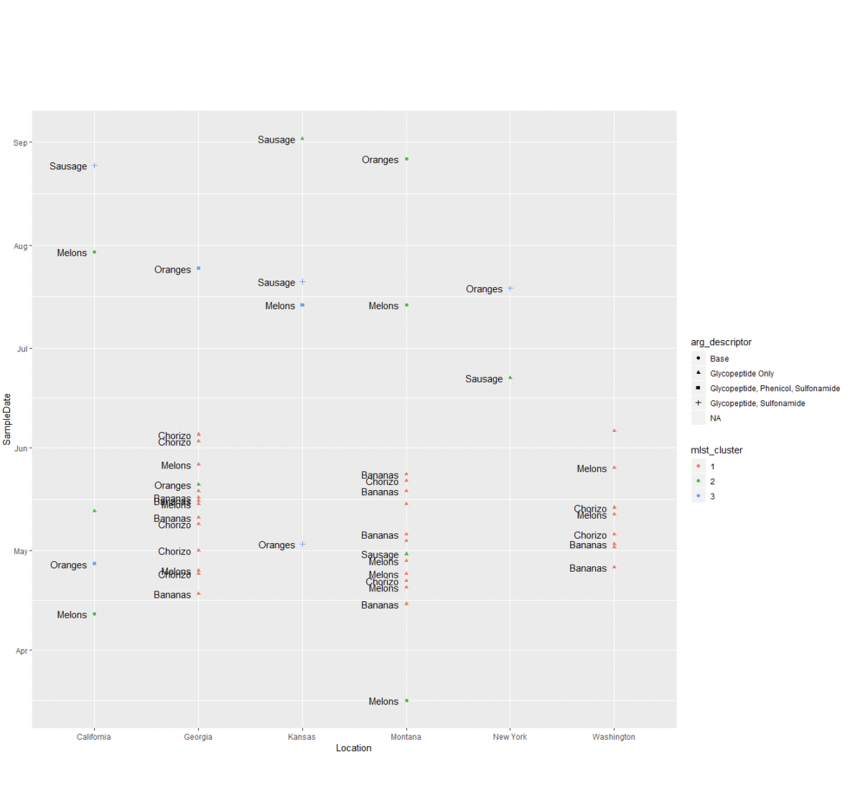
- To contextualize the epidemiological data, we generated a plot to get an idea of the timeline and locations:
- Figure 9 shows:
- X-axis: State of sample
- Y-axis: Date of sample
- This plot seems to show a group of cases happening concurrently in GA, MT, and WA starting in mid April and ending in June.
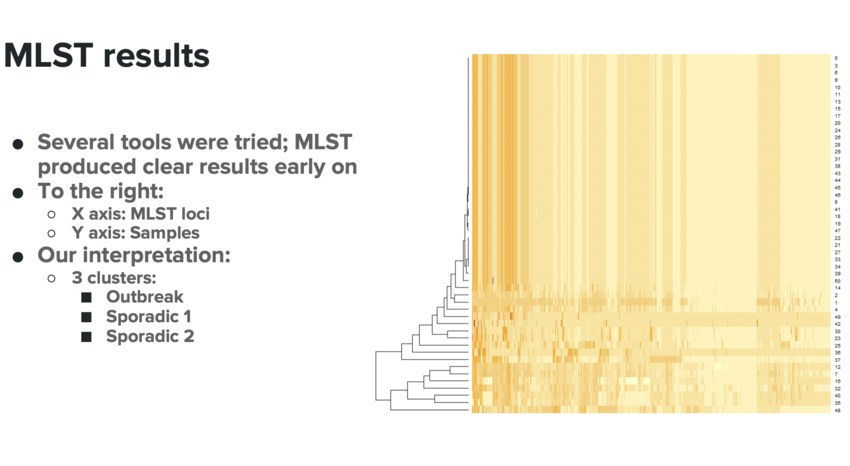
- Several tools were tried; MLST produced clear results early on
- As you can see in Figure 10:
- X axis: MLST loci
- Y axis: Samples
- Our interpretation:
- 3 clusters:
- Outbreak
- Sporadic 1
- Sporadic 2
- 3 clusters:

- Our team ran the appropriate data through strain analysis and incorporated functional annotation results
- MLST results perfectly supported what appeared from the epidata (see Figure 11a); an outbreak strain and perhaps a few sporadic strains.
- United on 3 foods:
- Melon
- Chorizo
- Bananas
- With clear strains, possessed of clear genetic relatedness, the question was whether they were treatable in a similar fashion
- Answer: Yes.
- All strains shared a base ARG set, according to deepARG (see Figure 11b)
- The outbreak strain was (fortunately) identical on this basis, and was quite vulnerable.
- Literature shows that Phenicol and Sulfonamides both work on the outbreak strain
SNP Level Analysis Results

- kSNP was used to determine the SNPs across the 50 isolates.
- Since, it is a K-mer based analysis tool, we had to specify the k-mer size.
- The appropriate k-mer size was determined using a program called Kchooser.
- That also gave us FCK(Fraction of kmers that are present in all genomes).
- It is a measure of sequence diversity, the lower is FCK the more diverse are the sequences.
- Studies have shown when FCK is ≥ 0.1 SNP detection efficiency is adequate, and the accuracy of parsimony trees estimated by kSNP3 is > 97%; i.e. the trees can be considered to be reliable.
- Our team used kSNP 3.0 to analyze and determine SNPs across the 50 isolates.
- kSNP uses k-mer analysis and the appropriate k-mer size for our dataset was 19.
- FCK: 0.422 (measure of sequence diversity)
- We then built phylogenetic trees to understand the diversity among the isolates.
| Gene | Allele | Length(bp) | Description |
|---|---|---|---|
| b0557 (iss) | 8 | 294 | Increased Serum Survival (ISS) Protein |
| ECO26_RS04705 (cif) | 4 | 830 | Effector Protein (Type III) |
| efa1 | 7 | 9672 | Adhesin Protein |
| nleA | 1 | 1221 | Effector Protein |
Table 2 :Virulence Profile
- b0557 (iss)
- Increased Serum Survival gene. The increased serum survival gene (iss) has long been recognized for its role in extraintestinal pathogenic Escherichia coli (ExPEC) virulence. iss has been identified as a distinguishing trait of avian ExPEC but not of human ExPEC
- ECO25_RS04705 (cif)
- Bacterial effectors are proteins secreted by pathogenic bacteria into the cells of their host, usually using a type 3 secretion system (TTSS/T3SS).
- efa1
- Efa1 (EHEC factor for adherence) is an adhesin. Adhesins are cell-surface components or appendages of bacteria that facilitate adhesion or adherence to other cells or to surfaces, usually in the host they are infecting or living in. Adhesins are a type of virulence factor.
- nleA
- bacterial effector protein; uses a type III secretion system to translocate effector proteins into the host cytosol.
Conclusion

- Our team identified the bacterial pathogen Escherichia coli O103:H2 str. 12009 the outbreak strain caused the food-borne illness that we investigated.
- Escherichia coli O103:H2 strain is a Shiga toxin-producing Escherichia coli (STEC) and is of public health significance as an important cause of food-borne illness.
- Our team identified the outbreak isolates to be:
- CGT1145, CGT1239, CGT1614, CGT1663
- CGT1965, CGT1121, CGT1395, CGT1425
- CGT1704, CGT1726, CGT1742, CGT1416
- CGT1903, CGT1964, CGT1217, CGT1241
- CGT1316, CGT1355, CGT1478, CGT1488
- CGT1691, CGT1784, CGT1803, CGT1887, and CGT1934
Outbreak Response Recommendation
- Preemptively suggest recalls of chorizo, banana, and melon from stores.
- In addition, these key measure should be used in daily practice by all:
- Wash hands and surfaces often
- Keep foods separate when preparing meals to reduce chances of cross-contamination
- Cook and store leftovers foods at the proper temperature
Recommended Classes of Antibiotics for Physicians to Prescribe
- Based upon this profile. We identified 2 antibiotics/antibiotic classes that would work best to respond to this outbreak:
- Phenicol or
- Sulfonamide class
Antibiotics for Physicians to Avoid
- Based on the ARG found in our outbreak strain, we found that that Escherichia coli O103:H2 str. 12009 is resistant to the following antibiotics:
- Aminoglycoside
- Bacitracin
- Beta-lactam
- Diaminopyrimidine
- Fluoroquinolone
- Fosmidomycin
- Macrolide
- Peptide
- Tetracycline
In-Class Presentations
- Comparative Genomics Background and Strategy:File:Team 1 CG Background & Strategy .pdf
- Comparative Genomics Final Results:File:Team 1 CG Final Results.pdf
References
- Chen X, Zhang Y, Zhang Z, Zhao Y, Sun C, Yang M, Wang J, Liu Q, Zhang B, Chen M, Yu J, Wu J, Jin Z and Xiao J (2018) PGAweb: A Web Server for Bacterial Pan-Genome Analysis. Front. Microbiol. 9:1910. doi: 10.3389/fmicb.2018.01910
- Maiden MC, Jansen van Rensburg MJ, Bray JE, et al. MLST revisited: the gene-by-gene approach to bacterial genomics. Nat Rev Microbiol. 2013;11(10):728-36.
- Marçais G, Delcher AL, Phillippy AM, Coston R, Salzberg SL, et al. (2018) MUMmer4: A fast and versatile genome alignment system. PLOS Computational Biology 14(1): e1005944. https://doi.org/10.1371/journal.pcbi.1005944
- Perez-Losada M, Arenas M, Castro-Nallar E. Microbial sequence typing in the genomic era. Infection, Genetics and Evolution. 2018;63:346-359. http://dx.doi.org/10.1016/j.meegid.2017.09.022
- Strockbine N, Bopp C, Fields P, Kaper J, Nataro J. 2015. Escherichia, Shigella, and Salmonella, p 685-713. In Jorgensen J, Pfaller M, Carroll K, Funke G, Landry M, Richter S, Warnock D (ed), Manual of Clinical Microbiology, Eleventh Edition. ASM Press, Washington, DC. doi: 10.1128/9781555817381.ch37
- Sultan, I., Rahman, S., Jan, A. T., Siddiqui, M. T., Mondal, A. H., & Haq, Q. M. R. (2018). Antibiotics, Resistome and Resistance Mechanisms: A Bacterial Perspective. Frontiers in Microbiology, 9(2066). doi:10.3389/fmicb.2018.02066
- Trees E, Rota P, Maccannell D, Gerner-smidt P.. Molecular Epidemiology, p 131-159. In Jorgensen J, Pfaller M, Carroll K, Funke G, Landry M, Richter S, Warnock D (ed), Manual of Clinical Microbiology, Eleventh Edition. ASM Press, Washington, DC. 2015. doi: 10.1128/9781555817381.ch10