Team II Genome Assembly Group
Team 2: Genome Assembly
Members: Kristine Lacek, Hanchen Wang, Rhiya Sharma, Shivam Sharma, Shuting Lin
Introduction
Genome assembly refers to the process of taking a large number of short DNA fragments and putting them back together to reconstruct the original genome of the organism. The main type of genome assembly used here is De Novo Genome Assembly, which assume no prior knowledge of the source DNA sequence length, layout or composition.
Objective: Take the input of 50 paired fastq files from an unknown species and perform genome assembly and species identification by trimming and aligning these short DNA sequences.
Code availability https://github.gatech.edu/compgenomics2020/Team2-GenomeAssembly
In-Class Presentations:
Pipeline Overview
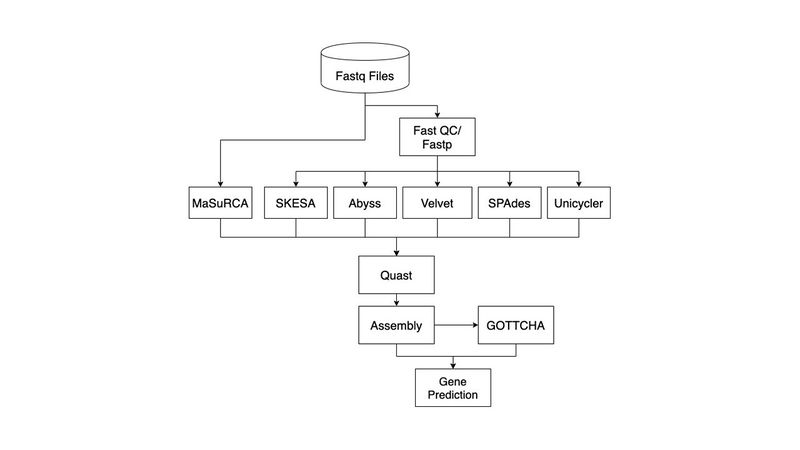
Quality Control and Trimming
Before de Novo assembly can begin, input fastq files needed to be evaluated and processed for quality. Subsequently, low quality reads as well as adapters required trimming to ensure a more accurate genome assembly. The tool used for pre-trimming quality control was FastQC (http://www.bioinformatics.babraham.ac.uk/projects/fastqc/). Following installation, the 100 provided fastq files were called into FastQC and the data summary text files locations were recorded. Summary files were iterated over and per-base sequence quality was compared to a threshold of 30. The first position to pass the threshold was selected to be the headcropping point for trimming. Subsequently, the final position to pass the quality control parameters was selected to be the tail cropping point for trimming. Trimming was then completed by FastP (https://github.com/OpenGene/fastp).
Following the generation of FastQC reports, output html files were aggregated using MultiQC (https://multiqc.info/). The following charts summarize the pre-QC fastq files:
- Pre-trim per base sequence quality was found to be lowest at the very front and tail parts of the sequence (Figure 1). We opted for a tool with automatic adapter trimming and coded for cropping that would adjust to the specific sequence quality positions per read.
- 95% of pre-trimmed sequences already had a mean quality score above 28 (Figure 2). The goal for trimming was to maximize percentage of sequences above 28 while minimizing total percentage trimmed, since most of the reads were already of high quality.

- Figure 1: per base sequence quality of pre-trimmed fastq files

- Figure 2: per read quality of pre-trimmed fastq files
Before FastP was selected as a tool for trimming, it was compared to Trimmomatic (http://www.usadellab.org/cms/?page=trimmomatic), another widely used trimming tool. FastP was found to be significantly faster than Trimmomatic, and also offered two major features that when implemented, optimized the complexity and runtime of this process. Firstly, FastP offers automatic adapter sensing, and since 50 paired end reads were passed through the pipeline, this feature allowed adapter trimmimg to be highly customized per fastq sequence. Secondly, output files from calling FastP include its own post-trim QC html and json files--negating the need for a subsequent calling of FastQC.
The 50 output html files were then combined using MultiQC (https://multiqc.info/) and the following parameters were found to optimize post-trim quality for all 50 inputs while maintaining a low percentage trimmed. None of the 50 paired end reads were discarded using these parameters.
- Head crop: customized per sequence, largest position in the first half of the seuquence with a quality score less than 28
- Crop: also customized per sequence, smallest position in the second half of the sequence with a quality score less than 28
- Minimum length: 75 bp
- Sliding window: 5 bp
- Qualified quality phred: 30
- Average quality filter: 28
Post-Trim Results
- Overall, 20.3% of bases from reads were trimmed (Figure 3). In order to have all positions above a phred score of 28, over 60% of reads needed to be trimmed. We chose these parameters to avoid discarding too much data.
- Our trimming parameters saw an increase to 80% of per base scores of high quality (Figure 4)
- Like base quality scores, per sequence quality scores also increased. 100% were above a phred score of 28 (Figure 5)
- Overall GC Content was found to be 31%

- Figure 3: Filtered reads of trimmed data.

- Figure 4: per base quality scores

- Figure 5: per sequence quality scores
Full Multi-QC reports are available here:
Assembly
Genome assembly refers to the process of taking a large number of short DNA sequences and putting them back together to create a representation of the original chromosomes from which the DNA originated. The two types of genome assemblies are - Reference Genome Assembly and De Novo Genome Assembly. Reference genome assemblers map reads to a reference genome while de novo assemblers construct an assembly without any prior knowledge of the source DNA sequence length, layout or composition.
As we have no prior knowledge of the provided raw sequence reads, we decided to use de novo assembly tools.
De Novo Assembly Tools
De novo assembly tools assemble short reads to create full-length sequences, without using a template. To assemble a genome, computer programs typically use data consisting of single and paired reads. Single reads are the short fragments of sequences that can be put together through overlapping regions into a continuous sequence known as a "contig". Paired reads are produced when the fragment size is too long to be sequenced straight through. The ends of these fragments are read in towards the middle, producing two “paired” reads - one from the left-hand end of the fragment and one from the right with a known separation distance between them.
Most de novo assembly tools use two types of algorithms - Overlap, Layout, Consensus (OLC) and De Bruijn Graphs. For our pipeline, studies like GAGE-B and GABenchToB - which considered eight bacteria sequenced on different sequencing machines, were used as benchmarking studies to shortlist 6 tools from a large pool (>24) of de novo assembly tools.
Velvet
Velvet is a de novo assembler that use short read sets as input (e.g. Illumina Reads), and the assembly method is based on de Bruijn graphs.
Step 1: Hashing. Velveth reads sequence files and builds a dictionary of all words of length k, where k is a user-defined parameter, thus defining exact local alignments between the reads.
Step 2: Graph building. Velvetg reads these alignments, builds a de Bruijn graph from them, removes errors and finally proceeds to simplify the graph and resolve repeats based on the parameters provided by the user.
K-mer Value Used: We tested k-mer = 31,61,91 to optimize k-mer, finally we used 91 for k-mer.
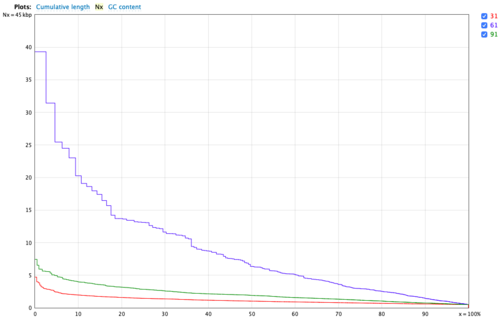
- Figure 6: Nx plot for Velvet.
ABySS: Assembly By Short Sequences
It is a parallelized sequence assembler intended for short paired-end reads. One of its few advantages is that it can provide a high N50. The assembly algorithm works in two steps:
Step 1: The contigs are extended until they can either not be unambiguously extended or they come to a blunt end due to a lack of coverage.
Step 2: The paired-end information is then used to resolve ambiguities and merge contigs
K-mer values used: 21, 33, 77
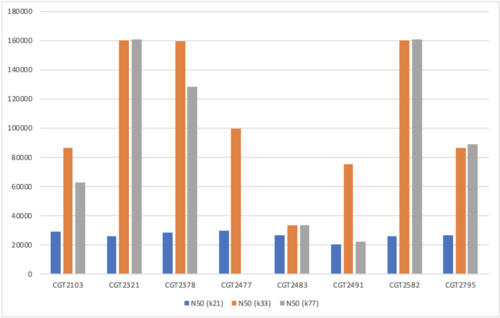
- Figure 7: N50 values for ABySS.
SKESA
SKESA is a DeBruijn graph-based de-novo assembler designed for assembling reads of microbial genomes sequenced using Illumina. Skesa uses multiple k-mer sizes for assembling the genome and is designed to create breaks at repeat regions in the genome.
SKESA only accepts k-mer value >= 21, and the default k-mer is 21. So we tested k-mer = 21,27,33 to find out the appropriate k-mer. Finally, we picked 27 for k-mer.
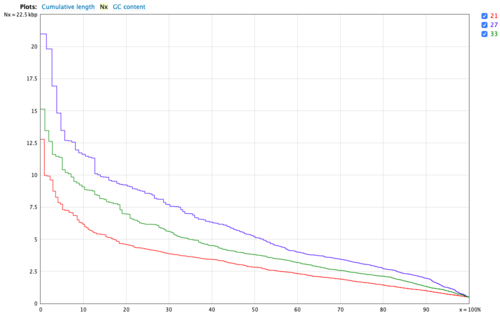
- Figure 8: Nx plot for SKESA.
MaSuRCA: Maryland Super Read Cabog Assembler
A toolkit which has an assembler, error corrector, a polisher and an aligner.
MaSuRCA assembler combines the benefits of deBruijn graph and Overlap-Layout-Consensus assembly approaches.
Specifically states on github to not use trimmed reads; also supported by supplementary table of GAGE-B, which reported best performance of MaSuRCA on raw reads.
Parameters Used:
- We used kmer-genie to estimate a k-mer for this tool; which reported 121 for 250bp & 115 for 150bp; and 79 & 89 from GAGE-B, selected on taxonomy.
- We also used k=89 and k=79; chosen from GAGE-B supplementary file based on taxonomic similarity.
Final Parameters:
- We used auto mode because a decisive inclination to any other value was not obtained.
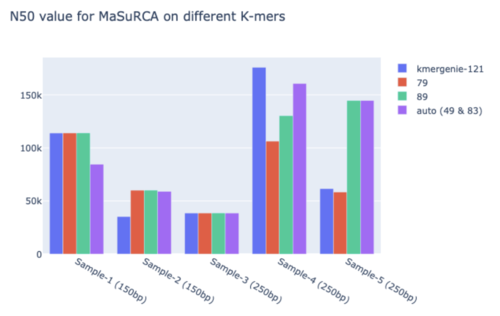
- Figure 9: N50 for MASuRCA.
SPAdes
Built upon the concept of paired de-bruijn, SPAdes performs k-bimer adjustment to find the near-precise distance between k-bimers.
The de-bruijn graph created is a multi-sized one for minimizing tangledness and fragmentation; it brings in smaller k-values for low coverage and larger k values for high coverage areas.
Uses modified Hammer correction for sequencing error introduced into reads.
Parameters Used:
- Auto mode: 21, 33, 55, 77
- GAGE-B in their supplementary files gave different sets; we picked 33,55,65,75,85,99 & 51,63,85 based on taxonomy.
- Carraro et al. had sequenced C. jejuni using 21,33,55,77 values on SPAdes with careful mode on.
- SPAdes recommended 21,33,55,77 & 21,33,55,77,99,127 for 150bp and 250bp Illumina reads.
Final Parameters:
- We used recommended values because a decisive inclination to any other value was not obtained.
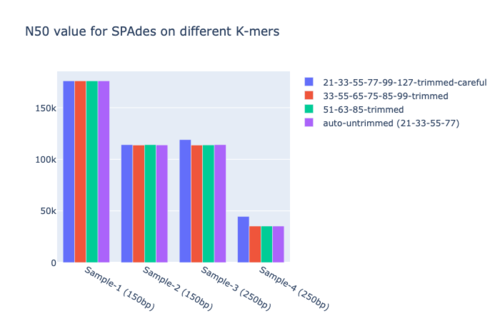
- Figure 10: N50 for SPAdes.
Unicycler
Unicycler functions as a SPAdes optimiser and can only assemble Illumina read sets. It utilises SPAdes graph assemblies - which are formed by performing a De Bruijn graph assembly with a range of different k-mer sizes. Each assembly builds on the previous one, which allows SPAdes to get the advantages of both small k-mer assemblies (a more connected graph) and large k-mer assemblies (ability to resolve repeats). Unicycler produces high-quality assemblies but is also very time-consuming.
Post-Assembly QC
The general rule of a high-quality assembly is the low number and long length of assembled contigs, in other words, larger N50 value.
QUAST (QUality ASsessment Tool) (http://quast.sourceforge.net/index.html) could evaluate the quality of the assembled contigs generated from various assemblers with full range of metrics. Among various publicly available tools for post-assembly QC, QUAST was selected based on several advantages. Firstly and most importantly, QUAST allows the usage without the reference genome, which satisfies the objective of the current project. Furthermore, instead of comparing a single N50 value, QUAST outputs multiple Nx (where 0<x<100) values to give better insight into the overall variation in contig length. Lastly, the various types of visualization reports would facilitate comparing the results from several assemblers.
Comparisons of Assembly Tools
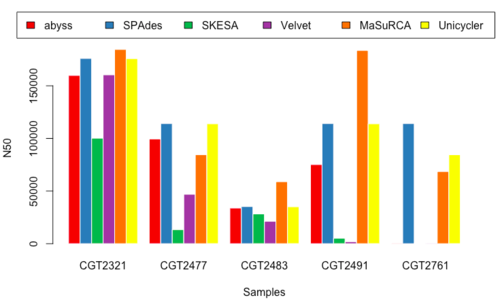
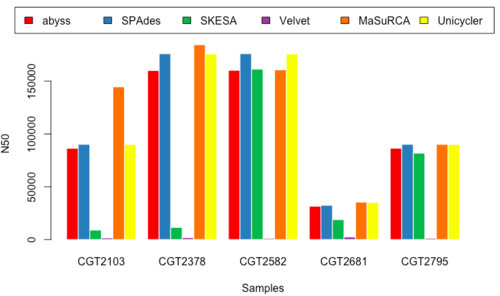
N50
- Figure 11 & 12: N50_150 & N50_250
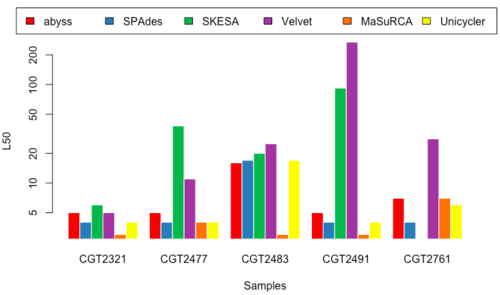
L50
- Figure 13 & 14: L50_150 & L50_250
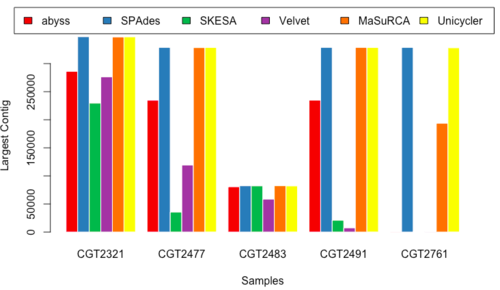
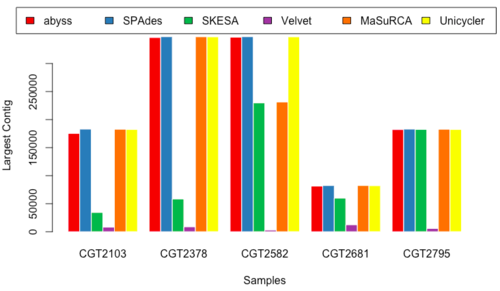
Largest Contig Length
- Figure 15 & 16: LC_150 & LC_250.
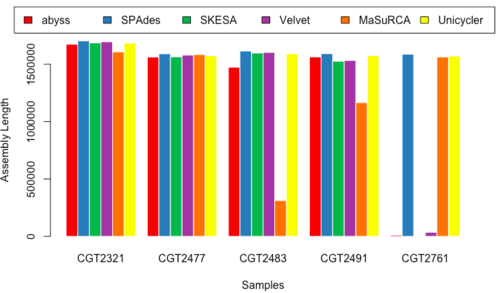
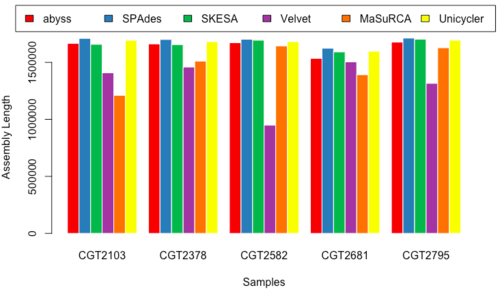
Assembled Length
- Figure 17 & 18: AL_150 & AL_250
Overview of Results
| Tool | N50 Mean | N50 SD | L50 Mean | L50 SD | Largest Contig Mean | Largest Contig SD | Total Length Mean | Total Length SD | |
| Spades | 96,531 | 43,359 | 7.94 | 5.8 | 239,985 | 107,442 | 1,637,646 | 52,794 | |
| Unicycler | 95,559 | 44,723 | 7.72 | 5.6 | 234,928 | 110,664 | 1,612,044 | 49,485 | |
| MaSuRCA | 123,022 | 62,000 | 5.02 | 2.9 | 223,048 | 103,047 | 1,264,992 | 381,822 |
Table 1: Comparison of three best assembly tools
Discussion
- Although no one golden tool surfaced from our analysis, we decided to select a subset of the tools executed in our pipeline.
- MaSuRCA, SPAdes, and Unicycler performed better than other tools, and produced similar results, so we selected these three for performing the assembly for our data.
- Upon comparison of the three assembled results, we noted that MaSuRCA sometimes failed to run and also deviated heavily from the values reported by SPAdes and Unicycler; whereas SPAdes and Unicycler were a little more consistent.
- We decided to use SPAdes upfront because of its consistency (Table 1)
Final Assembled Genome:
Species Identification
Species identification could be achieved by extracting SSU fragments from the assembled contigs and searching for matches in the available public databases with taxonomies (e.g. SILVA, RDP, and Greengenes).
The other simple method would be aligning the assembled contigs against the NCBI non-redundant (nr) database which could be achieved on the NCBI BLAST web page (https://blast.ncbi.nlm.nih.gov/Blast.cgi). BLAST (Basic Local Alignment Search Tool) detects the local alignments based on k-mer search. Among various BLAST tools, the BLASTn (nucleotide BLAST) is applicable for comparing the nucleotide query sequence against the nucleotide nr database.
We identified our species as C. jejuni
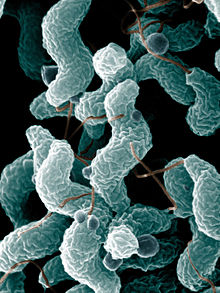
- Figure 19: Compylobactor jejuni
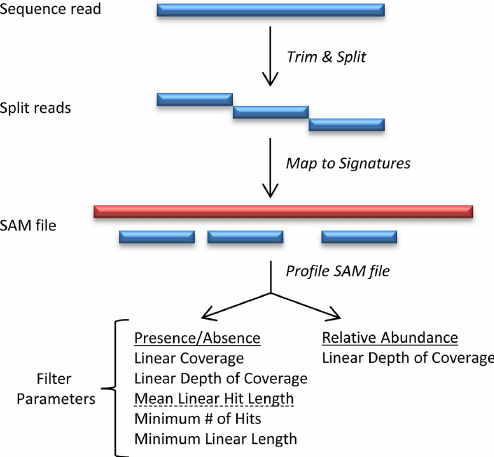
Species Identification Gottcha
- signature-based metagenomic taxonomic profiling method
- Laptop, local deployable
- Require huge database downloaded
- High speed compared to blast
$ bin/gottcha.pl \
     --threads 8             \
     --outdir ./             \
     --input test/test.fastq \
     --database database/GOTTCHA_BACTERIA_c4937_k24_u30_xHUMAN3x.species
LEVEL TAXA REL_ABUNDANCE LINEAR_LENGTH TOTAL_BP_MAPPED HIT_COUNT HIT_COUNT_PLASMID READ_COUNT LINEAR_DOC NORM_COV\ phylum Proteobacteria 1.0000 207680 1954326 55902 4 6584 9.41027542372881 1\ class Epsilonproteobacteria 1.0000 207680 1954326 55902 4 6584 9.41027542372881 1\ order Campylobacterales 1.0000 207680 1954326 55902 4 6584 9.41027542372881 1\ family Campylobacteraceae 1.0000 207680 1954326 55902 4 6584 9.41027542372881 1\ genus Campylobacter 1.0000 207680 1954326 55902 4 6584 9.41027542372881 1\ species Campylobacter jejuni 1.0000 207680 1954326 55902 4 6584 9.41027542372881 1\
Refrences
Andrews S. (2010). FastQC: a quality control tool for high throughput sequence data. Available online at: http://www.bioinformatics.babraham.ac.uk/projects/fastqc
Bolger, A. M., Lohse, M., & Usadel, B. (2014). Trimmomatic: A flexible trimmer for Illumina Sequence Data. Bioinformatics, btu170.
Shifu Chen, Yanqing Zhou, Yaru Chen, Jia Gu; fastp: an ultra-fast all-in-one FASTQ preprocessor, Bioinformatics, Volume 34, Issue 17, 1 September 2018, Pages i884–i890, https://doi.org/10.1093/bioinformatics/bty560
Philip Ewels, Måns Magnusson, Sverker Lundin and Max Käller. MultiQC: Summarize analysis results for multiple tools and samples in a single report. Bioinformatics (2016) doi: 10.1093/bioinformatics/btw354 PMID: 27312411
Bankevich, Anton et al. “SPAdes: a new genome assembly algorithm and its applications to single-cell sequencing.” Journal of computational biology : a journal of computational molecular cell biology vol. 19,5 (2012): 455-77. doi:10.1089/cmb.2012.0021
https://www.melbournebioinformatics.org.au/tutorials/tutorials/assembly/assembly-protocol/
https://bpa-csiro-workshops.github.io/btp-manuals-md/modules/btp-module-velvet/velvet/
ncbi.nlm.nih.gov/pmc/articles/PMC2952100/
Gurevich, A., Saveliev, V., Vyahhi, N., & Tesler, G. (2013). QUAST: quality assessment tool for genome assemblies. Bioinformatics, 29(8), 1072-1075.
Altschul, S.F., Gish, W., Miller, W., Myers, E.W. & Lipman, D.J. (1990) "Basic local alignment search tool." J. Mol. Biol. 215:403-410.
Simpson, J., Wong, K., Jackman, S., Schein, J., Jones, S. and Birol, I. (2009). ABySS: A parallel assembler for short read sequence data. Genome Research, 19(6), pp.1117-1123.
Shaun D Jackman, Benjamin P Vandervalk, Hamid Mohamadi, Justin Chu, Sarah Yeo, S Austin Hammond, Golnaz Jahesh, Hamza Khan, Lauren Coombe, René L Warren, and Inanc Birol (2017). ABySS 2.0: Resource-efficient assembly of large genomes using a Bloom filter. Genome research, 27(5), 768-777. doi:10.1101/gr.214346.116
Wick RR, Judd LM, Gorrie CL, Holt KE. Unicycler: Resolving bacterial genome assemblies from short and long sequencing reads. PLOS Computational Biology. 2017;13(6).
