Team III Genome Assembly Group
Group Members: Deepali Kundnani, Aparna Maddala, Swetha Singu, Yiqiong Xiao, Ruize Yang
Lectures
Introduction
Genome assembly is the process of combining the reads generated by sequencing technology into contiguous sequences that ultimately span a large portion of a genome. This can either be accomplished by examining how the reads overlap or examining their similarity to a reference genome. A standard genome assembly pipeline includes quality control, trimming, post-trimming quality control, sequence assembly, and assembly validation [1]. The objective of this project was to assemble bacterial genomes from 50 fastq files provided by CDC PulseNET. All of the samples were generated by paired-end sequencing on the Illumina platform.
Methods
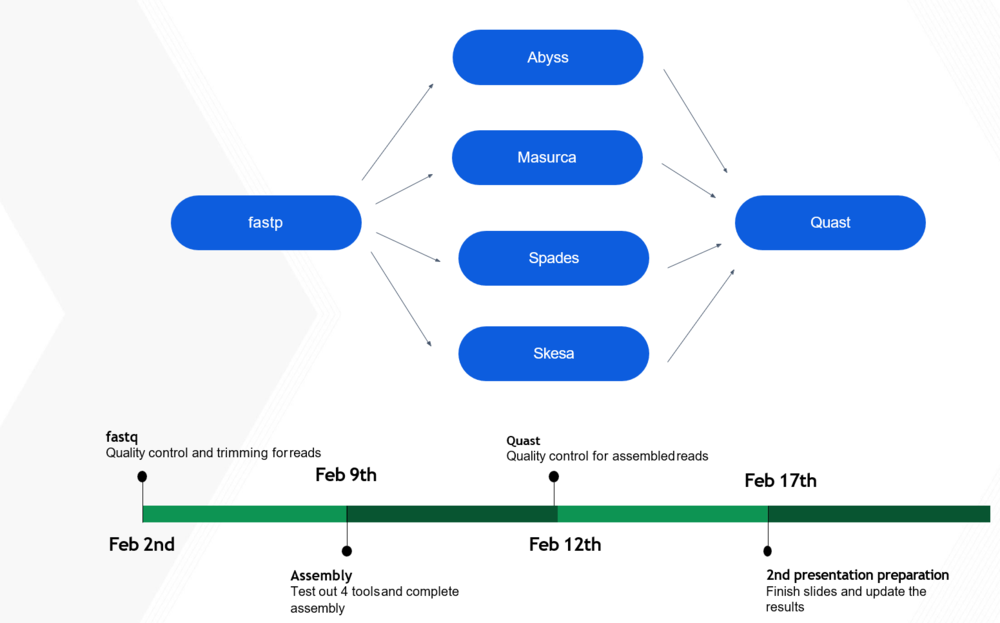
Proposed Testing Plan

Quality Control/Trimming
Tools used:
- fastp (https://github.com/OpenGene/fastp)
- MultiQC (https://multiqc.info/)
Tool Selection
For quality control, we compared two tools, fastp and FastQC (https://www.bioinformatics.babraham.ac.uk/projects/fastqc/). We first proved that the two programs generated identical information when run on identical fastq files, after which we compared the information displayed in the reports for both. While FastQC creates highly informative per-base sequence quality graphs, it runs significantly slower than fastp. We were able to extract biologically significant information from the charts generated from fastp, so we decided to use fastp for quality control.
Afterwards, we compared fastp's trimming features with those of Trimmomatic (http://www.usadellab.org/cms/?page=trimmomatic). Our data did not contain adapters, so we did not need an additional tool like CutAdapt (https://cutadapt.readthedocs.io/en/stable/) to remove them. We showed that most, if not all, of Trimmomatic's trimming features can be replicated in fastp. Furthermore, fastp contains a feature specifically for paired-end data where it can use a high-read to correct low confidence bases in its mate. Fastp has the added advantage of combining both quality control and trimming into a single step, increasing the speed and usability of our pipeline. Since we had 50 input files in our pipeline, we used MultiQC to consolidate the 50 separate quality control reports generated by fastp into a single report.
Pre-Trim Quality Control

Read 1 had high quality reads, so each of the 50 read 1 samples passed the mean quality score threshold of 28. However, read 2 was of lower quality, with only 25 samples passing the same mean quality threshold. This was mostly due to low quality regions at the 5' end of read 2. Because of this notable difference in quality between the two reads, we decided to trim read 1 and read 2 using different parameters. According to a comparison of trimming parameters on the assembly quality of Cyanoderma ruficeps genomes, trimming does not have a clear effect on assembly quality but speeds up most assembly implementations [2]. Therefore, in order to obtain high quality data to pass to the assemblers, we decided to completely trim the low-quality regions at the 3' and 5' ends of each read while retaining the high-quality middle regions.
Trimming Parameters
The following arguments were supplied to fastp in order to trim our data: -f 5 -F 30 -t 10 -e 28 -c -5 3 -M 27.
- -f 5 - globally trims 5 bases from 5' end of mate 1
- -F 30 - globally trims 30 bases from 5' end of mate 2
- -t 10 - globally trims 10 bases from 3' end of both mates
- -e 28 - discards reads with an average quality score under 28
- -c - turns on paired-end base correction, which slightly increased the quality of the 3' end of mate 2
- -5 3 - turns on sliding window trimming from 5' end with a window size of 3
- -M 27 - sets a quality threshold of 27 for sliding window
Assembly
Reference-based vs. de novo assembly
The two approaches for assembling high throughput sequencing reads into longer contiguous genomic sequences, are Reference-based assembly and Denovo assembly. Using reference based assembly approach we map each read to a reference genome sequence to assemble the given sequences, this helps in identify genetic variations like single nucleotide polymorphisms(SNPs), indels etc. This approach is possible when we know the organism (species) being sequenced and when this species has a reference genome. Otherwise, we go with Denovo assembly, where sequenced reads are compared to each other, and then overlapped reads are used to build longer contiguous sequences. De novo assembly is usually more time-consuming and the reliability of this assembly depends on the size of the reads and the number of gaps between the reads. The two main algorithms used for De novo assembly are: Overlap layout consensus and De Bruijn graph algorithm.
Genome and Plasmid assembly
Genome assembly is the computational process of putting back together the chromosomes that have been fragmented for sequencing. Genome is a collective reference to all the DNA molecules in the cell of an organism. There are many de novo assembly tools available that can assemble the genomes, however there is a shortage of specialized software tools for extracting and assembling plasmid data from whole genome sequencing projects. Plasmids are important genetic engineering tools and the vectors of horizontal gene transfer that may harbor genes involved in virulence and antibiotic resistance. Thus, studies of plasmids are important for understanding the evolution of these traits and for tracing the proliferation of drug-resistant bacteria.
Parameters considered when selecting assembly tool
The GAGE-B [Genome Assembly Gold-standard Evaluation for Bacteria] study suggests that assembly software performing well on one organism, performed poorly on another organism. Hence, it is wise to test several approaches; different software, assembly with or without pre-processing of the sequence data, and also with different parameter settings. Some of the parameters considered when selecting a tool are: Genome size, Ploidy, Coverage, Algorithm used, Time and memory consumed and the tool that can assemble and give largest N50 contig size, which is a common heuristic for selecting the best assembly when the true genome sequence is unknown.
Tools considered
AbySS
Our team chose ABySS (Assembly By Short Sequencing) based on the study “Abdul Rafay Khan et.al [2018] - “A Comprehensive Study of De Novo Genome Assemblers: Current Challenges and Future Prospective”. ABySS is a de novo, parallel, paired-end sequence assembler that is designed for short reads. The single-processor version is useful for assembling genomes up to 100 M bases in size. The parallel version is implemented using MPI and is capable of assembling larger genomes.
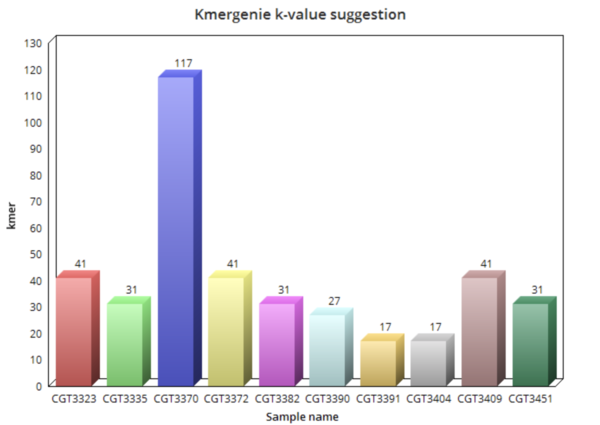
ABySS uses de Bruijn graph based algorithm and uses a multistage de novo assembly pipeline with Unitig, Contig and Scaffold stages. From ABySS version 2.0 a Bloom filter-based implementation of the unitig assembly stage is included to decrease memory usage. ABySS does not optimize the kmer so the kmer needs to be provided by user. Inorder, to find the right kmer for each sample we have used a kmercounter tool-kmergenie. Some other popular kmer counter tools are Jellyfish, DSK, ntCard.

For each sample kmergenie suggested a kmer value based on which, the final assembly is done for each sample. The final abyss results are analyzed in assembly quality using Quast and BUSCO and compared with other tools.
AbySS Version: 2.2.4
KmerGenie Version: 1.7051
MaSuRCA
Version: 3.3.5
MaSuRCA, or the Maryland Super-Read Celera Assembler, uses a combination of the OLC and de Bruijn Graph algorithms to assemble data. MaSuRCA normally creates longer contigs and offers higher N50 values. It works best on untrimmed data, which is possibly responsible for its slower computational time [2].
SPAdes
SPAdes is a genome assembly algorithm which was designed for single cell and multi-cells bacterial data sets.
Version: 3.13.0
Parameters:
K-mer size: SPAdes offers auto-detection
careful: Tries to reduce the number of mismatches and short indels, recommended only for assembly of small genomes.
Our group also found Unicycler, which can be used as a SPAdes optimiser. It came out in 2017 and is used mostly to assemble bacterial genomes.
Version: 0.4.7
Parameters:
--spades_path: It will read in the input files and generate the read error-corrected files using SPAdes.

Above shows the comparison of the N50 and L50 results of using SPAdes only and SPAdes with Unicycler. There is no major differences between the two tools. However, SPAdes runs significantly faster than including Unicycler. Thus, we decided to only use SPAdes to assemble the all 50 samples.
PlasmidSPAdes
PlasmidSPAdes is software tool for assembling plasmids from whole genome sequencing data. It has the potential to massively increase the throughput of plasmid sequencing and to provide information about plasmids in thousands of sequenced bacterial genomes by re-assembling their genomes and identifying their plasmids. It is a part of the SPAdes package.
SKESA
Skesa is a De Bruijn graph assembler for microbial genomes sequenced using Illumina. It auto-detects and uses multiple k-mer sizes. The default starting point is k=21. The feature of skesa is that it generates k-mers that are longer than reads and up to insert size. For paired-end reads, it will iterate using k-mer size up to mate length. In each iteration, the assembly uses the De Bruijn graph for that k-mer size and current set of contigs. After each iteration, some reads are used up and cannot provide new information, so they are removed. After k-mer size reach the average read length, all the remaining paired reads are connected. The assembled sequence is used for generating longer k-mers between average reads size and insert size. This feature makes SKESA to have high N50, and can assemble through repeat regions that are shorter than insert size but longer than read length.
Skesa does not have a build-in scaffolding tool, and scaffolding won't add to its performance. The default setting of Skesa is the best.
Version: 2.3.0
Usage: skesa --fasta/fastq sample1 sample2 --contigs_out assembled_fasta

Results
Post-Trimming Quality Control

After trimming, the quality of our read 1 data improved slightly. However, the largest difference can be observed in read 2 data, with all 50 of the samples passing the mean quality threshold of a Phred score of 28. The 5' and 3' ends of some of the read 2 samples are of low quality, but more aggressive trimming would most probably also eliminate high-confidence regions.

A vast majority of reads in each sample passed our filter, with at most 11% of reads falling below our quality and length thresholds and at most []% of bases trimmed from each sample.
Inter-Assembler Assessments
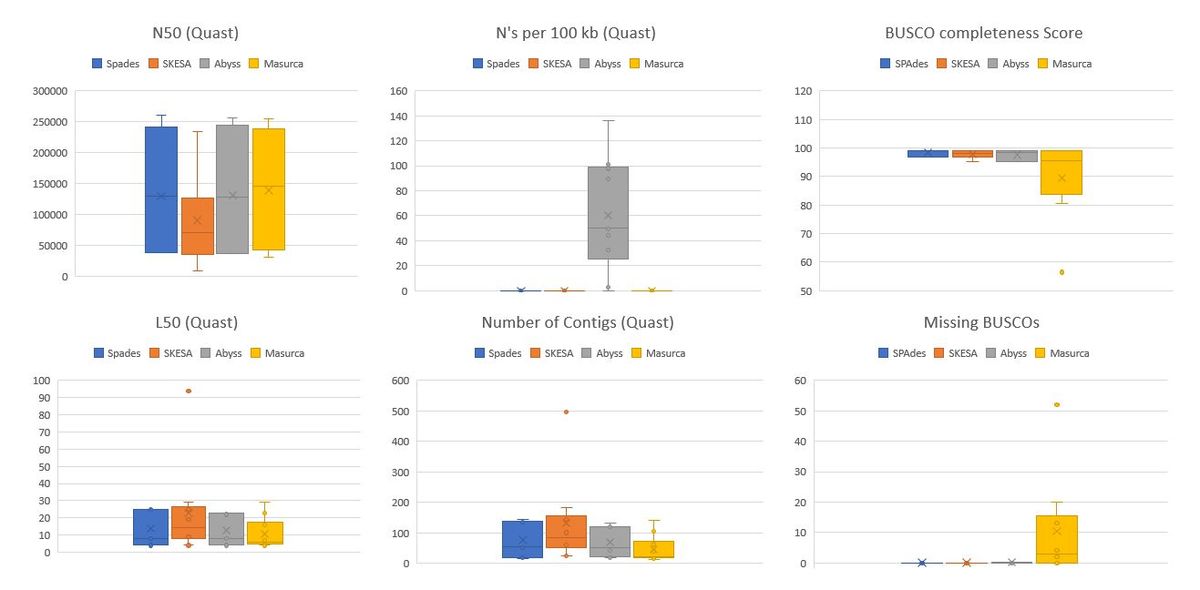
For quality assessment of Genome Assembly, we make use of the widely used software QUAST(QUaslity Assessment Tool for Genome Assembly) with BUSCO(Benchmarking Universal Single-Copy Orthologs) to complement the analysis. With Quast, we mainly on N50, L50, number of Contigs, N's per 100kb. BUSCO provides us with single copy, duplicated, missing and fragmented Benchmarking orthologs. Good assemblies are more complete with higher N50 and lower L50. Assemblies with poor error correction lead to higher duplicated BUSCOs and ones with data loss lead to missing or fragmented BUSCOs. Lower completeness scores with many fragmented BUSCOs can also be suggestive of misassemblies that Quast might not be able to detect without alignment to a reference genome and that is where BUSCO provides a better understanding fo the assembly quality.

We rule out Abyss based on the presence of N's per 100Kbp. In the previous analysis of different kmers on Abyss, the genome assemblies showed N's if the kmers were too low or too high. It's possible that the kmers suggested by KmerGenie are lower than optimal.
It is also evident that MaSuRCA has a lower Completeness score and missing BUSCOs suggesting the loss of valuable information from the Assembly. This again can be due high kmer selection which was seen to be around 99 for most of the samples. MaSuRCA can be a good tool for reads with higher sequencing depth or coverage and for organisms cultured prior to sequencing. It is safe to assume the worst-case scenario of working with non-cultured organisms having lower sequencing depth, we rule out MaSuRCA from the list of Assemblers for final Validation. With MaSuRCA we also run the risk of losing smaller genomes of plasmids that can play a role in horizontal gene transfer.
Since the comparisons were non-conclusive between Spades and SKESA by just using 10 libraries, we assemble genomes from all 50 libraries provided to us for finding the best assembly given this set of samples.

As seen from metrics from QUAST and BUSCO, Spades clearly outperforms SKESA in terms of giving us better N50 and lower L50 values for genomes assembled from the same libraries. With SKESA we also saw a varied distribution of these scores which indicates that SKESA, even though it has a sophisticated way of handling assemblies for each sample, might not be that effective. And when we look at the BUSCO completeness scores with fragmented/missing BUSCOs we see a similar trend.

Unlike MaSuRCA, while looking at each sample's N50 with BUSCO score, we do see a correlation of SKESA's lower N50's with lower completeness scores. These comparisons help us conclude that SPAdes is the best tool to be used for Genome Assembly regardless of the quality of the libraries it is provided and hence is the best assembler for our pipeline
Conclusions
Final Pipeline

Fastp will be used from trimming and MultiQC is used for quality check. Spades clearly outperforms all the other chosen assemblers for benchmarking and is the only assembler we will be using for all types of inputs from the user. Assembly quality will be provided by both Quast and BUSCO.
References
- Dominguez Del Angel V, Hjerde E, Sterck L et al. Ten steps to get started in Genome Assembly and Annotation [version 1; peer review: 2 approved]. F1000Research 2018, 7(ELIXIR):148 (https://doi.org/10.12688/f1000research.13598.1)
- Yang, S.-F.; Lu, C.-W.; Yao, C.-T.; Hung, C.-M. To Trim or Not to Trim: Effects of Read Trimming on the De Novo Genome Assembly of a Widespread East Asian Passerine, the Rufous-Capped Babbler (Cyanoderma ruficeps Blyth). Genes 2019, 10, 737.