Team II Comparative Genomics Group: Difference between revisions
| (141 intermediate revisions by 4 users not shown) | |||
| Line 1: | Line 1: | ||
== '''Team 2: Comparative Genomics''' == | == '''Team 2: Comparative Genomics''' == | ||
'''Team Members: | '''Team Members: Kara Keun Lee, Courtney Astore, Kristine Lacek, Ujani Hazra, Jayson Chao''' | ||
---- | ---- | ||
=='''Summary of Findings'''== | |||
*The species of bacterial pathogen that causes the foodborne illnesses that we are investigating is ''' ''Campybacter jejuni'' ''' [[File: st_date_summary.PNG |right| 400px|thumb| '''Figure:''' summary of sequence type over time.]] | |||
*The outbreak isolates are 7 isolate samples belonging to Sequence Type 2109: ''' CGT2103, CGT2278, CGT2371, CGT2448, CGT2648, CGT2704, CGT2795'''. | |||
*The outbreak ''' began in December of 2018 and ended in February of 2019 (3 months)'''. | |||
*The outbreak occurred in Eastern States: ''' Massachussets, Virginia, Ohio, and Florida '''. | |||
*We determined that '''food source of the outbreak was dairy (cookie dough and cheese)'''. | |||
*Our specific recommendations to the CDC are treatment with a Macrolide, and the public should be reminded to double-check expirations on milk, and not to drink unpasteurized milk. | |||
==='''Class Presentations'''=== | ==='''Class Presentations'''=== | ||
* [[media: Background.pdf | Background and Strategy]] | |||
* [[media: Results.pdf | Results]] | |||
== '''Introduction'''== | == '''Introduction'''== | ||
| Line 16: | Line 26: | ||
===='''Pipeline Overview'''==== | ===='''Pipeline Overview'''==== | ||
[[File: CG_final_pipeline.PNG]] | |||
== '''Objectives''' == | == '''Objectives''' == | ||
| Line 32: | Line 43: | ||
When performing phylogenomics, there are many options by which one can classify similarities and differences across the genome. Our approach utilizes tools from three different techniques. | When performing phylogenomics, there are many options by which one can classify similarities and differences across the genome. Our approach utilizes tools from three different techniques. | ||
=== '''ANI ''' === | === '''ANI ''' === | ||
Average Nucleotide Identity (ANI) is a measure of nucleotide-level genomic similarity between the coding regions of two genomes | ==== '''Definition ''' ==== | ||
Average Nucleotide Identity (ANI) is a measure of nucleotide-level genomic similarity between the coding regions of two genomes. A value of 70 % DDH (DNA-DNA hybridization, 1 kb fragments of genome) was proposed as a recommended standard for delineating species and it is a golden standard for species definition based on hybridization experiment. A 95% percent ANI corresponds to 70 % DDH in a study combining experiment hybridization and bioinformatic analysis of bacterial genomes. | |||
==== '''How to calculate ''' ==== | |||
Calculating ANI usually involves the fragmentation of genome sequences, followed by nucleotide sequence search, alignment, and identity calculation. The original algorithm to calculate ANI used the BLAST program as its search engine. As it is done in the hybridization experiment, one genome (query genome) will be chopped in to 1 kb fragments when comparing two genomes using bioinformatic tools. Then each of those 1 kb fragments will be search against genome B using blast or other local alignment tools (search for example). Then the identity of each 1 kb fragment will be calculated. The average identity value of those fragments will be used as ANI. The efficiency of the local alignment tools determine the time need to calculate ANI. | |||
A reciprocal search of genome B against genome A was then proposed to be more reliable and accurate, which is also called orthlogous ANI. | |||
[[File:Picture1.png|600px]] | |||
==== '''Tools and Algorithms ''' ==== | |||
There are a bunch of tools to use to calculate ANI, some of which are alignment-based while others are not. ANI values using different tools may be a little bit different but they are comparable. | |||
===== '''Alignment based tools ''' ===== | |||
* ANIb and ANIm ('''Jspecies: [https://imedea.uib-csic.es/jspecies/download.html''']) | |||
ANIb and ANIm represent blast-blast ANI and MUMer-based ANI. They are both one way ANI, without reciprocal search. Popular software includes JSpecies, java based ANI calculation. JSpecies is a friendly UI interface but cannot be used to calculate large datasets. | |||
* Reciprocal ANIb and ANIm ('''ani.rb: [https://github.com/lmrodriguezr/enveomics/blob/master/Scripts/ani.rb'''] '''OrthANI: [http://www.ezbiocloud.net/tools/orthoaniu.''']) | |||
Reciprocal ANIb and ANIm are the most popular ANI calculation method. Tools such as ani.rb and OrthANI, which are ruby and java based, respectively. Both ani.rb and OrthANI ani.rb can be used to calculate pairwise ANI for datasets with thousands of genomes. ani.rb is blast-based while OrthANI can use 3 different method such as blast, MUMer and usearch (usearch_local). | |||
* gANI (genome wide ANI)('''gANI: [ https://ani.jgi.doe.gov/html/download.php''']) | |||
gANI use high performance similarity search tool NSimScan: protein-coding genes (A, B) were compared at the nucleotide level. It reaches high speed via query aggregation, use of optimized bitwise operations in alignment computing, and by avoidance of dynamic programming | |||
===== '''Alignment free tools ''' ===== | |||
* fastANI (Mashmap based ANI) '''Tool: [https://github.com/ParBLiSS/FastANI'''] | |||
fast ANI use Mashmap: fragments of genome A are mapped to the reference genome (B) using Mashmap. Mashmap first indexes the reference genome and subsequently computes mappings as well as alignment identity estimates for each query fragment, one at a time. At the end of the Mashmap run, all the query fragments f1;f2 1⁄4fbjAj=lc are mapped to B. The results are saved in a set M containing triplets of the form 〈f, i, p〉, where f is the fragment id, i is the identity estimate, and p is the starting position where f is mapped to B. The subset of M (say Mforward) corresponding to the maximum identity mapping for each query fragment is then extracted. To further identify the reciprocal matches, each triplet 〈f, i, p〉 in Mforward is ‘‘binned’’ based on its mapping position in the reference, with its value updated to hf ; i; bini 1⁄4 hf ; i; bp=lci. Through this step, fragments which are mapped to the same or nearby positions on the reference genome are likely to get equal bin value. Next, Mreciprocal filters the maximum identity mapping for each bin. Finally, FastANI reports the mean identity of all the triplets in Mreciprocal | |||
[[File:Picture2.png|600px]] | |||
=== ''' MLST ''' === | === ''' MLST ''' === | ||
| Line 42: | Line 81: | ||
All loci of a given isolate compared to equivalent loci in other isolates (typing scheme based on a few thousand genes). | All loci of a given isolate compared to equivalent loci in other isolates (typing scheme based on a few thousand genes). | ||
* Creates wgMLST tree (different styles exist) | * Creates wgMLST tree (different styles exist) | ||
<u>Core-genome MLST (cgMLST):</u> | <u>Core-genome MLST (cgMLST):</u> | ||
| Line 50: | Line 88: | ||
* Profile of alleles (“sequence type” or ST) by calling the alleles | * Profile of alleles (“sequence type” or ST) by calling the alleles | ||
* Genome assembly optional – there are assembly free methods | * Genome assembly optional – there are assembly free methods | ||
<u>Ribosomal MLST (rMLST):</u> | <u>Ribosomal MLST (rMLST):</u> | ||
| Line 60: | Line 97: | ||
* 50,138 genomes | * 50,138 genomes | ||
* 1,286,733 alleles | * 1,286,733 alleles | ||
[[File:pubmlst.PNG|500px|border]] | [[File:pubmlst.PNG|center|500px|border]] | ||
===='''Tool: [http://jordan.biology.gatech.edu/page/software/stringMLST/ stringMLST''']==== | ===='''Tool: [http://jordan.biology.gatech.edu/page/software/stringMLST/ stringMLST''']==== | ||
| Line 67: | Line 104: | ||
* Downloads and builds databases from pubMLST using the most recent allele and profile definitions | * Downloads and builds databases from pubMLST using the most recent allele and profile definitions | ||
* Faster algorithm compared to traditional MLST tools that maintain high accuracy | * Faster algorithm compared to traditional MLST tools that maintain high accuracy | ||
[[File:stringMLST1.PNG|border|400px]] | [[File:stringMLST1.PNG|center|border|400px]] | ||
===='''Tool: [ | ===='''Tool: [https://github.com/tseemann/mlst mlst''']==== | ||
Assembly based MLST caller that scan contig files against traditional PubMLST typing schemes and uses BLASTN to align sequences to alleles | |||
* | * Very fast and searches all databases on pubMLST to automatically detect the organism, then calculates the STs. | ||
* Can build DB but also has bundle of all available databases in their software repository, which are regularly updated | |||
* | |||
[[File: | [[File:Mlst.PNG|center|900px]] | ||
===='''Tool: [https://github.com/sanger-pathogens/ariba ARIBA''']==== | ===='''Tool: [https://github.com/sanger-pathogens/ariba ARIBA''']==== | ||
| Line 106: | Line 143: | ||
* Has a higher sensitivity, specificity, and average Sn and Sp than kSNP | * Has a higher sensitivity, specificity, and average Sn and Sp than kSNP | ||
[[File:Lyve-set_paper_figure1.jpeg|600px]] [[File:Lyve-set_paper2.jpeg|600px]] | [[File:Lyve-set_paper_figure1.jpeg|600px]] [[File:Lyve-set_paper2.jpeg|600px]] | ||
===='''Tool: [https://harvest.readthedocs.io/en/latest/content/parsnp.html Parsnp''']==== | |||
* Rapid Core Genome Multi-Alignment | |||
* Output includes variant (SNP) calls, core genome phylogeny and multi-alignments | |||
* Uses information provided by multi-alignments flanking SNP sites for QC | |||
'''<u>Table:</u>''' SNP-based tool comparison | '''<u>Table:</u>''' SNP-based tool comparison | ||
[[File:SNP_tool_compare.jpeg|700px]] | [[File:SNP_tool_compare.jpeg|700px]] | ||
== '''Results''' == | |||
==='''ANI'''=== | |||
All the algorithm for calculation of ANI were used and tested based on computation time and ANI values. For alignment based ANI method, MUMmer based tools is fast and have identical results with blast based ANI value. For alignment-free method, mashmap based FastANI is computationally efficient and can be used for large datasets (more than 10000 genomes). We compare the computational efficiency of all the tool used and then select the most efficient method as the major ANI calculation tools and use as much as computer processors offered by class for following calculation. | |||
[[File:Presentation1.png|600px]] | |||
Then we calculate pairwise ANI values between each of the samples to cluster them into similar groups/species so that the following taxonomy assignment agains large database will be using much smaller size of data. When looking at the ANI values of all 50 samples give by the class, their pairwise values cluster into to major groups, with one group ANI value larger than 95% while the other group less than 86%. We then came to the conclusion that there are 2 bacterial species in all those samples. We test this result by running FastANI, ANIm and ANIb, they all show the same results. | |||
[[File:heatmap_all_new45464654.png|600px]] | |||
MUMer based ANI value generally show similar results with FastANI. We can still see those values cluster into 2 groups. | |||
[[File:ANIm_percentage_identity.png|600px]] | |||
As a comparison, traditional blast ANI values also give the same results | |||
[[File:ANIb_percentage_identity.png|600px]] | |||
Interestingly, for species with high pairwise ANI values (red in the above all three figures), they cluster into three small subgroups with ANI value larger than 95% but smaller than 99%, indicating that they might be 3 subspecies/subtypes of the same species. This has also been confirmed by the following MLST analysis, in which 3 MLST types were identified within the species with higher pairwise ANI values. | |||
After pairwise calculation, we randomly select 2-3 samples in the same group that were clustered by pairwise ANI values for taxonomy assignment. We manually curated a Campylobacter database (simply run a test to see the most close taxonomic affiliation), containing genomes of all the species in this genus according to NCBI RefSeq database. Then we run FastANI using the database as reference while selected samples as query to calculate ANI values using all the genomes in the database. Then look at the taxonomy information of the genome in the database that has the highest ANI values with query genome and define the query genome as the same species. We found that among all the 50 samples, 37 of them are Campylobacter jejuni, while the remaining 13 are Campylobacter coli. These 2 species are the most 2 commonly seen pathogens that can cause diarrhea. | |||
==='''MLST'''=== | |||
MLST tools were tested and the best tool for our pipeline was ''mlst'' based on following reasons: | |||
* Takes in contig files from Genome Assembly output and does not require assembly | |||
* Time to run 50 samples were 2 minutes 24 second, while stringMLST (with assembly time) took 4 minutes 21 seconds | |||
* Do not need to build db and specify a specific scheme (has auto-search feature unlike others that require curation of specific database) | |||
[[File:Mlstcode.PNG|600px]] | |||
To compare outputs from mlst (7-gene MLST), we performed analysis on our samples also with [https://https://github.com/B-UMMI/chewBBACA chewBBACA] (wgMLST/cgMLST) | |||
* Creates schemes and allele calls on complete or draft genomes resulting from de novo assemblies | |||
* Allele calling algorithm is based on Blast Score Ratio that can be run in multiprocessor settings | |||
[[File:Mlstcode2.PNG|600px]] | |||
===='''MLST Results'''==== | |||
There were 4 types of ST (sequence types) identified in our 50 samples by mlst tool: ST 45, ST 829, ST 2109, and ST 50. ChewBBACA cgMLST results very closely reflected the mlst results with 4 distinctive clusters. ST 829 were composed of only ''C.coli'' strains (13, identified in ANI & gene prediction), while 37 ''C.jejuni'' strains made up of 3 other STs. The following was visualized using [https://github.com/achtman-lab/GrapeTree GrapeTree]. | |||
[[File:Mlstresult.PNG|center|850px]] | |||
===='''MLST Results with Epidemiological Data'''==== | |||
Epidemiological data available to us included information on location, time, and up to 4 consumed food items. | |||
* '''ST vs. Time''': All STs with the exception of ST 2109, had cases well distributed throughout the year (June 2018 - May 2019). ST 2109 cases only occurred from December 2018 to February 2019 (3 month span). | |||
[[File:Mlstresult_time.PNG|center|600px]] | |||
We created a '''Microreact project''' to visualize the time-series MLST data: https://microreact.org/project/TYUx1N5L2 | |||
[[File:Mlstresult_microreact.PNG|center|border|500px]] | |||
* '''ST vs. Location''': All STs with the exception of ST 2109, had cases well distributed in all regions of US (9 states). ST 2109 cases were localized to the Eastern US (VA, MA, OH, FL). | |||
[[File:Mlstresult_location.PNG|center|800px]] | |||
* '''ST vs. Food''': All STs with the exception of ST 2109, had a wide variety of food associated to illness (ranging from produce to meat to grocery food items). ST 2109 cases also had some of these items, but it was the only ST linked to dairy foods (cookie batter and cheese). | |||
[[File:Mlstresult_food.PNG|center|600px]] | |||
MLST analysis with epi data indicates '''ST 2109 as the ''Campylobacter jejuni'' outbreak strains''' based on specific time frame and location and link to unique food source. | |||
[[File:St2109.PNG|center|150px]] | |||
==='''SNP Typing'''=== | |||
===='''ParSNP Results'''==== | |||
While ParSNP ran very quickly (~30 seconds) on our 10 isolate benchmarking pipeline, there was a disconnect between calculated statistics and subsequent tree generation (only 9/10 isolates represented in tree) Therefore, this tool was decided not to be optimal for our data. | |||
'''Figure:''' ParSNP calculates statistic (10 samples present with 1 reference genome) and ParSNP phylogenetic tree generated (only 9 samples present with 1 reference genome) | |||
[[File:parsnp_stats.PNG|350px]][[File:parsnp_results.PNG|800px]] | |||
===='''kSNP3.1 Results'''==== | |||
'''Determining k''': | |||
Since kSNP is a k-mer based tool, there exists an optimal size k for a specific dataset. To determine this value, we ran ''MakeFasta'' and ''Kchooser'' to determine the best k for our data. Our percent uniqueness plateued at 95.8%, so we reran with that plateu as the cutoff. Optimal k was determined to be k = 25 | |||
'''Figure:''' Kchooser output before and after a cutoff was specified. Note percentage asymptote at approximately 0.958 | |||
[[File:kchooser_results.PNG]] | |||
'''Figure:''' SNP count across sequences determined by kSNP3 tool. | |||
[[File:KSNP_SNPCount_Results.png|1000px]] | |||
'''Figure:''' SNP-based phylogeny annotated with locations of cases | |||
[[File:cladogram_locations.PNG|500px]] | |||
Like the results found with the MLST-based tools, we found little convergence with SNP-typing and location. | |||
'''Figure:''' SNP-based phylogeny results converged with MLST results | |||
[[File:cladogram_MLST.PNG|500px]] | |||
The 5 clades in our phylogenetic tree divide into the 4 Sequence Types determined by MLST analysis. | |||
=='''Outbreak Analysis Results'''== | =='''Outbreak Analysis Results'''== | ||
==='''Outbreak Response'''=== | ==='''Outbreak Response'''=== | ||
* Analyze date distribution / geographic outbreak plots | * Analyze date distribution / geographic outbreak plots | ||
* Refer related cases to physicians for treatment | * Refer related cases to physicians for treatment | ||
* Alert state labs of heightened related cases | * Alert state labs of heightened related cases | ||
'''Figure:''' Geographic Heat Map of Cases | |||
[[File: heat_map.PNG|400px]] | |||
Note that cases, while heightened in Mid-Atlantic region, are not clustered to any one specific area. Only two pairs of the 9 affected states are even bordering one another. | |||
'''Figure:''' Date distribution | '''Figure:''' Date distribution | ||
[[File:epi_hist.png| | [[File:epi_hist.png|800px]] | ||
Our specific dataset saw its first isolate sampled in late June of 2018. Cases then continued for almost 11 months until the final sample was taken in mid-May of 2019. December 2018 saw the month with the most reported cases. | |||
Starting in January of 2019, a ''C. jejuni'' outbreak began linked to pet-store puppies. We believe that because of a 3 state overlap between our outbreak and the puppy outbreak, that it is possible that a few of our isolates may be attributed to the puppy outbreak and not are not foodbourne. | |||
'''Figure:''' Frequency of different food types across samples. | '''Figure:''' Frequency of different food types across samples. | ||
[[File:epi_food.png| | [[File:epi_food.png|800px]] | ||
Food types reported fell into 4 different food categories. | |||
1. Dairy: cheese, cookie batter | |||
2. Grocery: chocolate, chips, wheat bread | |||
3. Meat: chorizo, grilled chicken, beef | |||
4. Produce: apples, avocado, celery, lettuce, oranges, melons | |||
Individual foods with the most cases associated with them were chorizo, beef, lettuce, and avacado. | |||
==='''Source of Outbreak'''=== | ==='''Source of Outbreak'''=== | ||
There is little correlation between locations and sequence types, and most sequence types have cases reported over the span of one year. We believe that there are many instances of sporadic strains but only one outbreak strain and source. This would explain how sister taxa in our phylogenetic tree only come from the same state 20% of the time. | |||
Our outbreak strain is ST 2109. It had cases on the East Coast only over the span of 3 months. The outbreak source traces back to Dairy: Cheese, Cookie batter. | |||
We found that our remaining strains, potentially linked to vegetables and meat, are sporadic given the wide variation of time, foods, and location, and do not classify as an outbreak. | |||
These findings are not surprising, given that ''C. jejuni'' has a nature of being highly sporadic. | |||
==='''Human Impact'''=== | ==='''Human Impact'''=== | ||
A ''C. jejuni'' infection is one of the leading causes of gastroentiritis in the United States. | |||
Acute Gastroentirits an inflammation of the intestinal lining, charachterized by emisis, chills, abdominal cramping/pain, fever, and diarrhea. | |||
However, ''C. jejuni'' can cause a multitude of other clinical manifestations including Meningitis, Miller-Fisher Syndrome, Periodontitis, Hepatitis, and infections of the bone or soft tissue. | |||
[[File: clinical.jpg|800px]] | |||
'''Figure''': Summary of clinical manifestations of ''C. jejuni'' infections according to [https://cmr.asm.org/content/28/3/687 Clinical Reviews of Epidemiology] | |||
==='''Treatment Strategy'''=== | ==='''Treatment Strategy'''=== | ||
* Determination of antibiotics that will be most effective and ineffective from AMR profile | * Determination of antibiotics that will be most effective and ineffective from AMR profile | ||
* Recommendation to health providers which antibiotics to avoid | |||
{| class = "wikitable" | |||
|'''AMR Gene Detected''' || '''Resistant to Drug/Class''' || '''Method of Antibiotic''' | |||
|- | |||
|APH2/3 || aminglycosides || Inhibition of 30s subunit | |||
|- | |||
|OXA184/451 || Beta-lactamase inhibitors || Blocks cell wall synthesis | |||
|- | |||
|SAT-4 || Streptothricin || Inhibition of 30s subunit | |||
|- | |||
| cmeA/B/C/R || ciprofloxacin, norfloxacin, cefotaxime, fusidic acid, erythromycin || not a specific class. cmeABC is a multidrug efflux pump | |||
|- | |||
|gryA || Flouroquinolone || DNA synthesis inhibitor | |||
|- | |||
| tetO || Tetracycline || 30s Subunit Inhibitor | |||
|} | |||
After eliminating the drugs and classes of drugs to which isolates could be resistant, we consulted [https://www.ncbi.nlm.nih.gov/pmc/articles/PMC3462042/ published studies] to assemble our final reccomendation. OXA184 is the resistant gene present in our outbreak strain (ST2109), so we particularly avoided Beta-lactamase inhibitors. We chose a class of drugs that would inhibit the 50s subunit, more specifically, Macrolides. Since a cmaABC efflux pump would resist erythromycin, we suggest 5-7 days of treatment with either azithromycin or clarithromycin. | |||
==='''CDC Recommendations'''=== | ==='''CDC Recommendations'''=== | ||
*Thoroughly wash vegetables | |||
*Double-check expiration dates of meat/dairy products | |||
*Cook meat to the correct temperature | |||
*Notify healthcare providers in 9 states of recommended antibiotics (Macrolides) | |||
*Encourage sick individuals to seek medical treatment and stay home from school or work | |||
=='''Works Cited'''== | =='''Works Cited'''== | ||
| Line 180: | Line 381: | ||
21. https://www.cdc.gov/foodsafety/outbreaks/investigating-outbreaks/index.html | 21. https://www.cdc.gov/foodsafety/outbreaks/investigating-outbreaks/index.html | ||
22. https://www.ncbi.nlm.nih.gov/pmc/articles/PMC4870677/ | |||
23. https://www.genome.jp/kegg/annotation/br01600.html | |||
24. https://card.mcmaster.ca/ontology/37153 | |||
25. https://www.orthobullets.com/basic-science/9059/antibiotic-classification-and-mechanism | |||
26. https://www.ncbi.nlm.nih.gov/pmc/articles/PMC3462042/ | |||
27. https://cmr.asm.org/content/28/3/687 | |||
28. https://www.cdc.gov/campylobacter/outbreaks/puppies-12-19/index.html | |||
| | ||
Latest revision as of 15:08, 24 April 2020
Team 2: Comparative Genomics
Team Members: Kara Keun Lee, Courtney Astore, Kristine Lacek, Ujani Hazra, Jayson Chao
Summary of Findings
- The species of bacterial pathogen that causes the foodborne illnesses that we are investigating is Campybacter jejuni
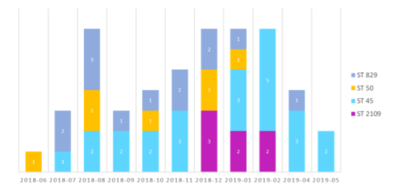
Figure: summary of sequence type over time. - The outbreak isolates are 7 isolate samples belonging to Sequence Type 2109: CGT2103, CGT2278, CGT2371, CGT2448, CGT2648, CGT2704, CGT2795.
- The outbreak began in December of 2018 and ended in February of 2019 (3 months).
- The outbreak occurred in Eastern States: Massachussets, Virginia, Ohio, and Florida .
- We determined that food source of the outbreak was dairy (cookie dough and cheese).
- Our specific recommendations to the CDC are treatment with a Macrolide, and the public should be reminded to double-check expirations on milk, and not to drink unpasteurized milk.

Class Presentations
Introduction
What is Comparative Genomics?
Once genomes are fully assembled and annotated, outbreak analysis can begin via comparative genomics. Generally, metadata ascertained from gene prediction and annotation can be used to map the relatedness of multiple isolates. Combined with epidemiological data, a given outbreak can be mapped back to a particular source (patient zero) and tracked to determine which strains are outbreak isolates and which are sporadic cases. Furthermore, phenotypic features such as virulence, antibiotic resistance, and pathogenicity can be determined. Compilation of these data allows for recommendations to be made on behalf of human impact, treatment strategy, and management methods to address further spread.
Our Data
- Our genomic data comes from 50 isolates of C. jejuni from an outbreak of foodborne illnesses. The genomes are assembled and fully annotated.
- Our epidemiological data include times, locations, and ingested foods of each case.
Pipeline Overview

Objectives
- Identify kinds of strains (outbreak vs. sporadic)
- Construct phylogeny demonstrating which isolates are related and which differ
- Determine the source of the outbreak
- Map virulence and antibiotic resistance features of outbreak isolates
- Compile recommendations for outbreak response and treatment
Overview of Techniques
When performing phylogenomics, there are many options by which one can classify similarities and differences across the genome. Our approach utilizes tools from three different techniques.
ANI
Definition
Average Nucleotide Identity (ANI) is a measure of nucleotide-level genomic similarity between the coding regions of two genomes. A value of 70 % DDH (DNA-DNA hybridization, 1 kb fragments of genome) was proposed as a recommended standard for delineating species and it is a golden standard for species definition based on hybridization experiment. A 95% percent ANI corresponds to 70 % DDH in a study combining experiment hybridization and bioinformatic analysis of bacterial genomes.
How to calculate
Calculating ANI usually involves the fragmentation of genome sequences, followed by nucleotide sequence search, alignment, and identity calculation. The original algorithm to calculate ANI used the BLAST program as its search engine. As it is done in the hybridization experiment, one genome (query genome) will be chopped in to 1 kb fragments when comparing two genomes using bioinformatic tools. Then each of those 1 kb fragments will be search against genome B using blast or other local alignment tools (search for example). Then the identity of each 1 kb fragment will be calculated. The average identity value of those fragments will be used as ANI. The efficiency of the local alignment tools determine the time need to calculate ANI.
A reciprocal search of genome B against genome A was then proposed to be more reliable and accurate, which is also called orthlogous ANI.

Tools and Algorithms
There are a bunch of tools to use to calculate ANI, some of which are alignment-based while others are not. ANI values using different tools may be a little bit different but they are comparable.
Alignment based tools
ANIb and ANIm represent blast-blast ANI and MUMer-based ANI. They are both one way ANI, without reciprocal search. Popular software includes JSpecies, java based ANI calculation. JSpecies is a friendly UI interface but cannot be used to calculate large datasets.
Reciprocal ANIb and ANIm are the most popular ANI calculation method. Tools such as ani.rb and OrthANI, which are ruby and java based, respectively. Both ani.rb and OrthANI ani.rb can be used to calculate pairwise ANI for datasets with thousands of genomes. ani.rb is blast-based while OrthANI can use 3 different method such as blast, MUMer and usearch (usearch_local).
- gANI (genome wide ANI)(gANI: [ https://ani.jgi.doe.gov/html/download.php])
gANI use high performance similarity search tool NSimScan: protein-coding genes (A, B) were compared at the nucleotide level. It reaches high speed via query aggregation, use of optimized bitwise operations in alignment computing, and by avoidance of dynamic programming
Alignment free tools
fast ANI use Mashmap: fragments of genome A are mapped to the reference genome (B) using Mashmap. Mashmap first indexes the reference genome and subsequently computes mappings as well as alignment identity estimates for each query fragment, one at a time. At the end of the Mashmap run, all the query fragments f1;f2 1⁄4fbjAj=lc are mapped to B. The results are saved in a set M containing triplets of the form 〈f, i, p〉, where f is the fragment id, i is the identity estimate, and p is the starting position where f is mapped to B. The subset of M (say Mforward) corresponding to the maximum identity mapping for each query fragment is then extracted. To further identify the reciprocal matches, each triplet 〈f, i, p〉 in Mforward is ‘‘binned’’ based on its mapping position in the reference, with its value updated to hf ; i; bini 1⁄4 hf ; i; bp=lci. Through this step, fragments which are mapped to the same or nearby positions on the reference genome are likely to get equal bin value. Next, Mreciprocal filters the maximum identity mapping for each bin. Finally, FastANI reports the mean identity of all the triplets in Mreciprocal

MLST
MLST or Multi-locus Sequence Typing identifies a set of loci (housekeeping genes) in the genome and compares each locus in a genome against the set of loci. It estimates the relationships between bacteria based on allelic variations in specific loci than their nucleotide sequences. MLST data can be used to investigate evolutionary relationships among bacteria. However, the sequence conservation of the housekeeping genes limits the discriminatory power of MLST in differentiating bacterial strains.
There are several types of MLST:
Whole-genome MLST (wgMLST): All loci of a given isolate compared to equivalent loci in other isolates (typing scheme based on a few thousand genes).
- Creates wgMLST tree (different styles exist)
Core-genome MLST (cgMLST): Focused on only the core elements of the genomes of a group of bacteria (typing scheme based on a few hundred genes).
7-Gene MLST: Chooses 7 loci in the genome and compare all genomes to these 7 loci.
- Profile of alleles (“sequence type” or ST) by calling the alleles
- Genome assembly optional – there are assembly free methods
Ribosomal MLST (rMLST): Based on 53 loci that code for ribosomal proteins present in most bacteria.
Database: PubMLST
PubMLST (Public databases for molecular typing and microbial genome diversity) for Campylobacter jejuni/coli (as of 17MAR2020):
- 98,017 isolates
- 50,138 genomes
- 1,286,733 alleles

Tool: stringMLST
stringMLST is a tool for detecting the MLST of an isolate directly from the genome sequencing reads.
- Predicts the ST of an isolate in a complete assembly and alignment-free manner
- Downloads and builds databases from pubMLST using the most recent allele and profile definitions
- Faster algorithm compared to traditional MLST tools that maintain high accuracy

Tool: mlst
Assembly based MLST caller that scan contig files against traditional PubMLST typing schemes and uses BLASTN to align sequences to alleles
- Very fast and searches all databases on pubMLST to automatically detect the organism, then calculates the STs.
- Can build DB but also has bundle of all available databases in their software repository, which are regularly updated

Tool: ARIBA
Assembly based tool, primarily developed for identifying Anti-Microbial Resistance - associated genes and single nucleotide polymorphisms directly from short reads
- Provides inbuilt support for and functionality for multi-locus sequence typing (MLST) using data from PubMLST
- Provides inbuilt support for PlasmidFinder and VFDB (Virulence Factor Databases)
- Can be used in the study of Virulence Profile and AMR features along with the results from the Functional Annotation group
SNP Typing
SNP stands for Single Nucleotide Polymorphism, meaning that certain alleles have two or three possibilities as to which base is at a given locus. As SNPs accumulate through de novo mutations and are passed down through generations, comparing a given isolate's SNPs to other isolates and a reference genome allow ascertainment of phylogenetic distance between samples(1). Tools have been developed to compare bases position by position (SNP-calling) and create matrices to compute relatedness between samples based on common SNPs.

Generalized Algorithm Overview:
- Pre-processing and read cleaning
- Mapping
- SNP calling against a reference genome
- Phylogeny generation based on SNP profiles
Tools to be tested:
Tool: kSNP3.0
- Optimal for situations where whole genome alignments don't work
- k-mer-based approaches are alignment-free and have a faster runtime
- Multiple kSNP versions have been created and thoroughly tested

Tool: Lyve-SET
- MSA-based approach (computationally expensive)
- Consistent performance according to literature
- Has a higher sensitivity, specificity, and average Sn and Sp than kSNP


Tool: Parsnp
- Rapid Core Genome Multi-Alignment
- Output includes variant (SNP) calls, core genome phylogeny and multi-alignments
- Uses information provided by multi-alignments flanking SNP sites for QC
Table: SNP-based tool comparison

Results
ANI
All the algorithm for calculation of ANI were used and tested based on computation time and ANI values. For alignment based ANI method, MUMmer based tools is fast and have identical results with blast based ANI value. For alignment-free method, mashmap based FastANI is computationally efficient and can be used for large datasets (more than 10000 genomes). We compare the computational efficiency of all the tool used and then select the most efficient method as the major ANI calculation tools and use as much as computer processors offered by class for following calculation.

Then we calculate pairwise ANI values between each of the samples to cluster them into similar groups/species so that the following taxonomy assignment agains large database will be using much smaller size of data. When looking at the ANI values of all 50 samples give by the class, their pairwise values cluster into to major groups, with one group ANI value larger than 95% while the other group less than 86%. We then came to the conclusion that there are 2 bacterial species in all those samples. We test this result by running FastANI, ANIm and ANIb, they all show the same results.

MUMer based ANI value generally show similar results with FastANI. We can still see those values cluster into 2 groups.

As a comparison, traditional blast ANI values also give the same results

Interestingly, for species with high pairwise ANI values (red in the above all three figures), they cluster into three small subgroups with ANI value larger than 95% but smaller than 99%, indicating that they might be 3 subspecies/subtypes of the same species. This has also been confirmed by the following MLST analysis, in which 3 MLST types were identified within the species with higher pairwise ANI values.
After pairwise calculation, we randomly select 2-3 samples in the same group that were clustered by pairwise ANI values for taxonomy assignment. We manually curated a Campylobacter database (simply run a test to see the most close taxonomic affiliation), containing genomes of all the species in this genus according to NCBI RefSeq database. Then we run FastANI using the database as reference while selected samples as query to calculate ANI values using all the genomes in the database. Then look at the taxonomy information of the genome in the database that has the highest ANI values with query genome and define the query genome as the same species. We found that among all the 50 samples, 37 of them are Campylobacter jejuni, while the remaining 13 are Campylobacter coli. These 2 species are the most 2 commonly seen pathogens that can cause diarrhea.
MLST
MLST tools were tested and the best tool for our pipeline was mlst based on following reasons:
- Takes in contig files from Genome Assembly output and does not require assembly
- Time to run 50 samples were 2 minutes 24 second, while stringMLST (with assembly time) took 4 minutes 21 seconds
- Do not need to build db and specify a specific scheme (has auto-search feature unlike others that require curation of specific database)
![]()
To compare outputs from mlst (7-gene MLST), we performed analysis on our samples also with chewBBACA (wgMLST/cgMLST)
- Creates schemes and allele calls on complete or draft genomes resulting from de novo assemblies
- Allele calling algorithm is based on Blast Score Ratio that can be run in multiprocessor settings
![]()
MLST Results
There were 4 types of ST (sequence types) identified in our 50 samples by mlst tool: ST 45, ST 829, ST 2109, and ST 50. ChewBBACA cgMLST results very closely reflected the mlst results with 4 distinctive clusters. ST 829 were composed of only C.coli strains (13, identified in ANI & gene prediction), while 37 C.jejuni strains made up of 3 other STs. The following was visualized using GrapeTree.

MLST Results with Epidemiological Data
Epidemiological data available to us included information on location, time, and up to 4 consumed food items.
- ST vs. Time: All STs with the exception of ST 2109, had cases well distributed throughout the year (June 2018 - May 2019). ST 2109 cases only occurred from December 2018 to February 2019 (3 month span).

We created a Microreact project to visualize the time-series MLST data: https://microreact.org/project/TYUx1N5L2

- ST vs. Location: All STs with the exception of ST 2109, had cases well distributed in all regions of US (9 states). ST 2109 cases were localized to the Eastern US (VA, MA, OH, FL).

- ST vs. Food: All STs with the exception of ST 2109, had a wide variety of food associated to illness (ranging from produce to meat to grocery food items). ST 2109 cases also had some of these items, but it was the only ST linked to dairy foods (cookie batter and cheese).

MLST analysis with epi data indicates ST 2109 as the Campylobacter jejuni outbreak strains based on specific time frame and location and link to unique food source.

SNP Typing
ParSNP Results
While ParSNP ran very quickly (~30 seconds) on our 10 isolate benchmarking pipeline, there was a disconnect between calculated statistics and subsequent tree generation (only 9/10 isolates represented in tree) Therefore, this tool was decided not to be optimal for our data.
Figure: ParSNP calculates statistic (10 samples present with 1 reference genome) and ParSNP phylogenetic tree generated (only 9 samples present with 1 reference genome)


kSNP3.1 Results
Determining k: Since kSNP is a k-mer based tool, there exists an optimal size k for a specific dataset. To determine this value, we ran MakeFasta and Kchooser to determine the best k for our data. Our percent uniqueness plateued at 95.8%, so we reran with that plateu as the cutoff. Optimal k was determined to be k = 25
Figure: Kchooser output before and after a cutoff was specified. Note percentage asymptote at approximately 0.958

Figure: SNP count across sequences determined by kSNP3 tool.

Figure: SNP-based phylogeny annotated with locations of cases

Like the results found with the MLST-based tools, we found little convergence with SNP-typing and location.
Figure: SNP-based phylogeny results converged with MLST results

The 5 clades in our phylogenetic tree divide into the 4 Sequence Types determined by MLST analysis.
Outbreak Analysis Results
Outbreak Response
- Analyze date distribution / geographic outbreak plots
- Refer related cases to physicians for treatment
- Alert state labs of heightened related cases
Figure: Geographic Heat Map of Cases

Note that cases, while heightened in Mid-Atlantic region, are not clustered to any one specific area. Only two pairs of the 9 affected states are even bordering one another.
Figure: Date distribution

Our specific dataset saw its first isolate sampled in late June of 2018. Cases then continued for almost 11 months until the final sample was taken in mid-May of 2019. December 2018 saw the month with the most reported cases.
Starting in January of 2019, a C. jejuni outbreak began linked to pet-store puppies. We believe that because of a 3 state overlap between our outbreak and the puppy outbreak, that it is possible that a few of our isolates may be attributed to the puppy outbreak and not are not foodbourne.
Figure: Frequency of different food types across samples.

Food types reported fell into 4 different food categories.
1. Dairy: cheese, cookie batter
2. Grocery: chocolate, chips, wheat bread
3. Meat: chorizo, grilled chicken, beef
4. Produce: apples, avocado, celery, lettuce, oranges, melons
Individual foods with the most cases associated with them were chorizo, beef, lettuce, and avacado.
Source of Outbreak
There is little correlation between locations and sequence types, and most sequence types have cases reported over the span of one year. We believe that there are many instances of sporadic strains but only one outbreak strain and source. This would explain how sister taxa in our phylogenetic tree only come from the same state 20% of the time.
Our outbreak strain is ST 2109. It had cases on the East Coast only over the span of 3 months. The outbreak source traces back to Dairy: Cheese, Cookie batter.
We found that our remaining strains, potentially linked to vegetables and meat, are sporadic given the wide variation of time, foods, and location, and do not classify as an outbreak.
These findings are not surprising, given that C. jejuni has a nature of being highly sporadic.
Human Impact
A C. jejuni infection is one of the leading causes of gastroentiritis in the United States. Acute Gastroentirits an inflammation of the intestinal lining, charachterized by emisis, chills, abdominal cramping/pain, fever, and diarrhea.
However, C. jejuni can cause a multitude of other clinical manifestations including Meningitis, Miller-Fisher Syndrome, Periodontitis, Hepatitis, and infections of the bone or soft tissue.

Figure: Summary of clinical manifestations of C. jejuni infections according to Clinical Reviews of Epidemiology
Treatment Strategy
- Determination of antibiotics that will be most effective and ineffective from AMR profile
- Recommendation to health providers which antibiotics to avoid
| AMR Gene Detected | Resistant to Drug/Class | Method of Antibiotic |
| APH2/3 | aminglycosides | Inhibition of 30s subunit |
| OXA184/451 | Beta-lactamase inhibitors | Blocks cell wall synthesis |
| SAT-4 | Streptothricin | Inhibition of 30s subunit |
| cmeA/B/C/R | ciprofloxacin, norfloxacin, cefotaxime, fusidic acid, erythromycin | not a specific class. cmeABC is a multidrug efflux pump |
| gryA | Flouroquinolone | DNA synthesis inhibitor |
| tetO | Tetracycline | 30s Subunit Inhibitor |
After eliminating the drugs and classes of drugs to which isolates could be resistant, we consulted published studies to assemble our final reccomendation. OXA184 is the resistant gene present in our outbreak strain (ST2109), so we particularly avoided Beta-lactamase inhibitors. We chose a class of drugs that would inhibit the 50s subunit, more specifically, Macrolides. Since a cmaABC efflux pump would resist erythromycin, we suggest 5-7 days of treatment with either azithromycin or clarithromycin.
CDC Recommendations
- Thoroughly wash vegetables
- Double-check expiration dates of meat/dairy products
- Cook meat to the correct temperature
- Notify healthcare providers in 9 states of recommended antibiotics (Macrolides)
- Encourage sick individuals to seek medical treatment and stay home from school or work
Works Cited
1. Touchman, J. (2010). "Comparative Genomics". Nature Education Knowledge. 3 (10): 13.
2. Xia, X. (2013). Comparative Genomics. SpringerBriefs in Genetics. Heidelberg: Springer. doi:10.1007/978-3-642-37146-2. ISBN 978-3-642-37145-5.
3. Goris, J., Konstantinidis, K. T., Klappenbach, J. A., Coenye, T., Vandamme, P., & Tiedje, J. M. (2007). DNA-DNA hybridization values and their relationship to whole- genome sequence similarities. International Journal of Systematic and Evolutionary Mi- crobiology, 57, 81–91
4. Konstantinidis, K. T., & Tiedje, J. M. (2005). Genomic insights that advance the species definition for prokaryotes. Proceedings of the National Academy of Sciences of the United States of America, 102, 2567–2572.
5. Arahal, D.R. (2014). Whole-genome analyses: average nucleotide identity. In: Methods in microbiology. Elsevier, pp. 103-122.
6. Richter, M., & Rossello ́-Mo ́ra, R. (2009). Shifting the genomic gold standard for the prokaryotic species definition. Proceedings of the National Academy of Sciences of the United States of America, 106, 19126–19131.
7. Varghese, N.J., Mukherjee, S., Konstantinidis, K.T. & Mavrommatis, K. (2015) Microbial species delineation using whole genome sequences. Nucleic Acid Research, 43, 6761–6771.
8. Wayne, L. G., Brenner, D. J., Colwell, R. R., Grimont, P. A. D., Kandler, O., Krichevsky, M. I., Moore, L. H., Moore, W. E. C., Murray, R. G. E. & other authors (1987). International Committee on Systematic Bacteriology. Report of the ad hoc committee on reconciliation of approaches to bacterial systematics. Int J Syst Bacteriol 37, 463–464.
9. Jain, C., Dilthey, A., Koren, S., Aluru, S. & Phillippy, A. M. A fast approximate algorithm for mapping long reads to large reference databases. In International Conference on Research in Computational Molecular Biology (Springer, Hong Kong, 2017).
10. https://www.applied-maths.com/applications/mlst
11. https://www.ncbi.nlm.nih.gov/pmc/articles/PMC5472909/
12. https://pubmlst.org/campylobacter/
13. https://www.ncbi.nlm.nih.gov/pmc/articles/PMC5610716/
14. https://academic.oup.com/bioinformatics/article/33/1/119/2525695
15. https://www.ncbi.nlm.nih.gov/pmc/articles/PMC5857373/
16. Lee, T., Guo, H., Wang, X. et al. SNPhylo: a pipeline to construct a phylogenetic tree from huge SNP data. BMC Genomics 15, 162 (2014). https://doi.org/10.1186/1471-2164-15-162
17. Katz, Lee S et al. “A Comparative Analysis of the Lyve-SET Phylogenomics Pipeline for Genomic Epidemiology of Foodborne Pathogens.” Frontiers in microbiology vol. 8 375. 13 Mar. 2017, doi:10.3389/fmicb.2017.00375
18. Shea N Gardner, Tom Slezak, Barry G. Hall, kSNP3.0: SNP detection and phylogenetic analysis of genomes without genome alignment or reference genome, Bioinformatics, Volume 31, Issue 17, 1 September 2015, Pages 2877–2878, https://doi.org/10.1093/bioinformatics/btv271
19. https://www.ncbi.nlm.nih.gov/pmc/articles/PMC6737581/#!po=11.3636
20. https://www.ncbi.nlm.nih.gov/pmc/articles/PMC5243249/
21. https://www.cdc.gov/foodsafety/outbreaks/investigating-outbreaks/index.html
22. https://www.ncbi.nlm.nih.gov/pmc/articles/PMC4870677/
23. https://www.genome.jp/kegg/annotation/br01600.html
24. https://card.mcmaster.ca/ontology/37153
25. https://www.orthobullets.com/basic-science/9059/antibiotic-classification-and-mechanism
26. https://www.ncbi.nlm.nih.gov/pmc/articles/PMC3462042/
27. https://cmr.asm.org/content/28/3/687
28. https://www.cdc.gov/campylobacter/outbreaks/puppies-12-19/index.html